
Abstract
Background
Colorectal cancer (CRC), the third most prevalent malignancy globally, causes ~1.9 million annual cases, necessitating novel therapies. Although 5-fluorouracil (5-FU) is a first-line chemotherapy, its efficacy is limited by resistance and toxicity, with response rates of only 10-15% in metastatic CRC. Combining 5-FU with natural compounds, such as Aloe barbadensis Miller (AVE), may enhance therapeutic outcomes by modulating resistance mechanisms.
Materials and Methods
This study evaluated the combined treatment effects of 5-FU and AVE in HCT116 and HT29 CRC cells using real-time proliferation (xCELLigence), mitochondrial stress assays (Seahorse XFe24), and total RNA sequencing.
Results
The combination of 5-FU and AVE (5-FuAve) significantly reduced cell proliferation and mitochondrial respiration in both cell lines. Transcriptome analysis revealed 524 upregulated and 98 downregulated genes in HCT116 and 57 upregulated and 17 downregulated genes in HT29. Seven tumor-suppressor genes, including FBLN2, INPP5D, and TP53INP1, were commonly upregulated, while oncogenic regulators such as PLK1 and CDC20 were downregulated in both lines. HT29 cells displayed an apoptosis-associated transcriptomic signature, supported by MAPK pathway enrichment, whereas HCT116 cells showed transcriptomic features consistent with a potential ferroptotic response., as indicated by ALOX5 upregulation and arachidonic acid pathway engagement. Despite differing molecular mechanisms, both cell lines exhibited comparable antitumor responses.
Conclusion
These findings suggest that 5-FuAve exerts multi-modal anti-cancer effects through cell-type-specific mechanisms, offering a promising strategy for addressing chemoresistance in CRC. Future studies should dissect the individual contributions of 5-FU and AVE to validate these observations and support therapeutic development.
Keywords: fluorouracil, aloe vera, oxygen consumption rate (OCR), xCELLigence, colorectal cancer
Introduction
Colorectal cancer (CRC) ranks as the third most prevalent malignancy globally, accounting for approximately 1.9 million new cases annually, and represents the second leading cause of cancer-associated deaths (). Projections indicating that nearly 1.6 million individuals may succumb to CRC by 2040 () underscore the urgent need for novel therapeutic approaches in its management. A major challenge in CRC treatment lies in the limited efficacy of existing therapies, primarily due to chemoresistance or poor treatment response (, ). This issue is further compounded by the metastatic progression of cancer cells, complicating clinical outcomes. The cornerstone of CRC chemotherapy is 5-fluorouracil (5-FU), a pyrimidine analog (, ). However, only a small fraction (~3%) of the administered dose exerts cytotoxic effects on tumor cells via anabolic pathways (). While uracil and 5-FU derivatives are readily taken up by tumor cells, 5-FU’s primary antitumor mechanism involves the inhibition of thymidylate synthase (TS), thereby disrupting DNA replication (, ). Additionally, its metabolite 5-fluorouridine triphosphate incorporates into RNA, impairing RNA synthesis and function ().
Despite its widespread use, 5-FU demonstrates limited efficacy in CRC, with significant side effects and a response rate of merely 10-15% in advanced metastatic cases (, ). Nevertheless, it remains a first-line chemotherapeutic agent, prompting research into strategies to enhance its therapeutic index. Combination therapies incorporating 5-FU and other anticancer agents have improved response rates to 40-50% (, ). However, dose escalation to augment efficacy often leads to severe toxicity and acquired resistance (). Consequently, exploring effective combinations of 5-FU with complementary drugs is critical to overcoming these limitations. Research has demonstrated that folinic acid not only mitigates the adverse effects of 5-FU but also enhances its therapeutic efficacy (, ). Similarly, in actinic keratosis–a potential precursor to squamous cell carcinoma–the combination of 5-FU with calcipotriol (a synthetic vitamin D3 analog) exhibited fewer side effects compared to conventional treatments (). In CRC, the co-administration of 5-FU and thymoquinone suppressed tumorigenesis by downregulating the cancer stem cell marker CD133 (). In hepatocellular carcinoma, combining 5-FU with salinomycin overcame chemoresistance by reducing CD133 and EPCAM expression in cancer stem cells. This combination also inhibited the Wnt/β-catenin pathway, preventing nuclear translocation of active β-catenin and reversing epithelial mesenchymal transition a key mechanism linked to drug resistance (). Another study on colon cancer revealed that the Irinotecan/5-FU combination disrupted mitochondrial membrane integrity and induced apoptosis via caspase activation in HT29 and SNU-C4 cell lines (). Parallel findings showed that 5-FU and curcumin in combination promoted cell death in CNE-2Z cells by suppressing NF-κB activity and upregulating the pro-apoptotic protein Bax (). Aloe barbadensis Miller (AVE), a widely recognized medicinal plant, exhibits low-toxicity antineoplastic effects in various cancers of the lung, breast, colon, and liver (-). Its potential to inhibit metastasis and counteract drug resistance has been well-documented (). In gastric, colon, and hepatocellular carcinoma cell lines, comparative analyses of AVE extracts identified AVE gel as the most potent antitumor agent, with Aloe-emodin also demonstrating significant activity (). AVE contains over 75 bioactive compounds, including minerals, vitamins, enzymes, and saponins, with its therapeutic benefits likely arising from their synergistic interactions rather than isolated effects (, ).
This study found that combining 5-FU with AVE enhanced the antitumor effect in CRC by augmenting malignant cells' response to chemotherapy and potentially modulating resistance-associated mechanisms, thus improving the therapeutic outcomes of 5-FU.
Materials and Methods
Cell Culture
BEAS-2B (ATCC® CRL-3588™, human bronchial epithelium), HCT116 (ATCC® CCL-247™, human colorectal carcinoma), and HT29 (ATCC® HTB-38™, human colorectal adenocarcinoma) were obtained from the American Type Culture Collection (Manassas, VA, USA). Cells were maintained in exponential growth phase in DMEM medium (GIBCO, Invitrogen, Carlsbad, CA, USA) supplemented with 10% heat-inactivated fetal bovine serum (GIBCO), 10 U of penicillin per mL (GIBCO), and 10 µg streptomycin per mL (GIBCO) at 37 °C in a 5% CO2 humidified atmosphere. Cells treated with trypan blue at a 1:1 ratio were placed on a TC20 slide and enumerated using the TC20 Cell Counter (Bio-Rad, USA). AVE leaves were rinsed with dH2O and dried on filter paper. After they were dried, the leaves were homogenized to create a gel, which was then centrifuged at 300×g for 3 minutes. The resulting gel was diluted with dH2O and mixed at 60 °C for two hours. The mixture was subsequently filtered at 12,000 rpm for 20 minutes, and the supernatant was concentrated to the desired volume (3.01 g) under low pressure. 5-FU (Sigma Aldrich, USA) used in this experiment was dissolved in DMSO to create a 20 mg/mL stock solution, which was stored at -20 °C.
Real-time Monitoring of Cell Proliferation by xCELLigence System
To measure the cytotoxic response of BEAS-2B, HCT116, and HT29 cell lines in real time, cells were seeded into 96-well microplates (E-plates)at a density of 15×103 cells/well, 4×10⁴ cells/well and 3×10⁴ cells/well, respectively. The E-plates feature small gold electrodes on the bottom that record impedance changes, which are dynamically translated into Cell Index (CI) values by the xCELLigence Real-Time Cell Analysis (RTCA) MP instrument (Agilent Technologies, USA). Analyses were performed at 37 °C with 5% CO2 using the xCELLigence. The cells were subsequently treated with eight different concentrations of 5-FU (5, 10, 15, 20, 25, 30, 35, and 40 µg/mL) and AVE (5, 8, 10, 15, 25, 30, 35, and 40 µg/mL), with each concentration tested in triplicate. For each cell line, untreated cells served as the control group. According to RTCA MP results, the IC50 value of 5-FU was 21.38 µg/mL and 17.58 µg/mL, and the IC50 value of AVE was 14.52 µg/mL and 15.08 µg/mL in HCT116 and HT29, respectively.
Mitochondrial Stress Profiling in HCT116 and HT29 Cell Lines Using SeaHorse XFe24 Flux Analyzer
For mitochondrial respiration analysis, cells were seeded at a density of 2×10⁴ cells/well in 100 µL medium in XFe24 cell culture microplates and incubated at 37 °C with 5% CO2. After a 24-h incubation period, cells were treated with IC50 concentrations of 5-FU (21.38 µg/mL in HCT116 and 17.58 µg/mL in HT29) and AVE (14.52 µg/mL in HCT116 and 15.08 µg/mL in HT29) as determined by RTCA MP. The treated cells were kept at 37 °C for 48 hours in a humidified atmosphere with 5% CO2. During the last 24 h of treatment, the sensor cartridge was prepared by loading 1 mL of SeaHorse XFe24 Calibrant Solution into each well and incubating overnight at 37 °C in a CO2-free environment for 1 hour to allow pH stabilization. For the mitochondrial stress test, oligomycin (an ATP synthase inhibitor), FCCP (an uncoupling agent), and rotenone/antimycin A (complex I/III inhibitors) from the Seahorse XF Cell Mito Stress Kit (Agilent Technologies, USA) were loaded into the designated cartridge ports at the concentrations specified by the manufacturer. The humidified sensor cartridge was then loaded into the XFe24 analyzer, and the prepared cell culture plate was carefully placed to obtain real-time metabolic measurements. After completing the run, analyses were conducted with the Seahorse Wave Controller Software 2.4.
Total RNA Isolation and Quality Assessment
Total RNA was extracted from control cells and from cells treated with the FU and AVE, extract (5-FuAve) combination using the EZ-10 Spin Column Total RNA Miniprep Kit (BioBasic, USA). Following overnight incubation at 37 °C, cells were treated with optimized compound concentrations and then incubated for 48 hours. Cell lysis was performed using the provided lysis buffer, followed by homogenization with 70% ethanol. The lysate was transferred to EZ-10 spin columns and centrifuged at 12.000×g for 1 minute. Subsequent washes were performed with RW and RPE buffers to remove contaminants. Purified RNA was eluted in 50 µL of RNase-free water and immediately stored at -80 °C. RNA quality control was performed using two complementary approaches: total RNA concentration was determined using the Qubit 4.0 Fluorometer with the Qubit RNA Broad Range Kit (Thermo Fisher Scientific), and RNA integrity was assessed using the TapeStation 4150 system with RNA ScreenTape (Agilent Technologies); all samples demonstrated RNA Integrity Numbers (RIN) >8.0.
RNA-Seq Library Preparation and Sequencing
Transcriptome profiling was conducted using total RNA sequencing. Ribosomal RNA depletion was performed on 100 ng of high-quality total RNA (RIN >8) using the QIAseq FastSelect RNA Library Kit (QIAGEN, USA). First-strand cDNA synthesis was performed using random primers, followed by second-strand synthesis incorporating deoxyuridine triphosphate to ensure strand specificity. Libraries were prepared through adapter ligation and unique dual indexing to enable multiplexing. PCR amplification was optimized to 12 cycles to prevent over-amplification artifacts. Library quantification was performed using the Qubit dsDNA High Sensitivity Assay (Thermo Fisher Scientific), followed by equimolar pooling of all samples at 2 nM. Final library quality was verified by capillary electrophoresis (TapeStation 4150) before sequencing. Paired-end sequencing (2×150 bp) was performed on the NovaSeq 6000 platform (Illumina, USA) with a target depth of 40 million reads per sample.
Functional Enrichment Analysis of Deregulated Genes
Differentially expressed genes (DEGs) in HCT116 and HT29 cells treated with 5-FuAve were identified using the QIAGEN CLC Genomics Workbench Premium (version 23.0.4). Read counts were normalized using the TMM (Trimmed Mean of M-values) method, and differential expression analysis was performed using a negative binomial distribution-based statistical model. Genes with a log2 fold change (FC) less than -2.0 or greater than 2.0, along with a p value <0.05 and FDR-adjusted p value <0.05, were selected for downstream in silico analyses. Gene ontology (GO) and pathway analyses were conducted and visualized using the SRplot web server (). Comparative transcriptomic analysis, Kaplan-Meier survival analysis, and protein–protein interaction network construction were performed using the Protein Interaction Network Analysis (PINA) v3.0 platform, with the Colon Adenocarcinoma (TCGA-COAD) dataset from The Cancer Genome Atlas serving as the cancer reference. Based on mRNA expression levels, patients were stratified into upper 50% and lower 50% groups. Overall survival (OS) was used as the endpoint, and Spearman correlation yielded a coefficient of 0.1 ().
This study does not require ethical committee approval and informed consent because it does not involve human or animal subjects and is based solely on commercially purchased cell lines.
Statistical Analysis
Results were presented as mean values ± standard deviation. All experimental data were obtained from three replicates and were assessed using one-way analysis of variance with a significance threshold of p < 0.05.
Results
Determination of Antiproliferative and Cytotoxic Effects of 5-FU and AVE on BEAS-2B, HCT116, and HT29
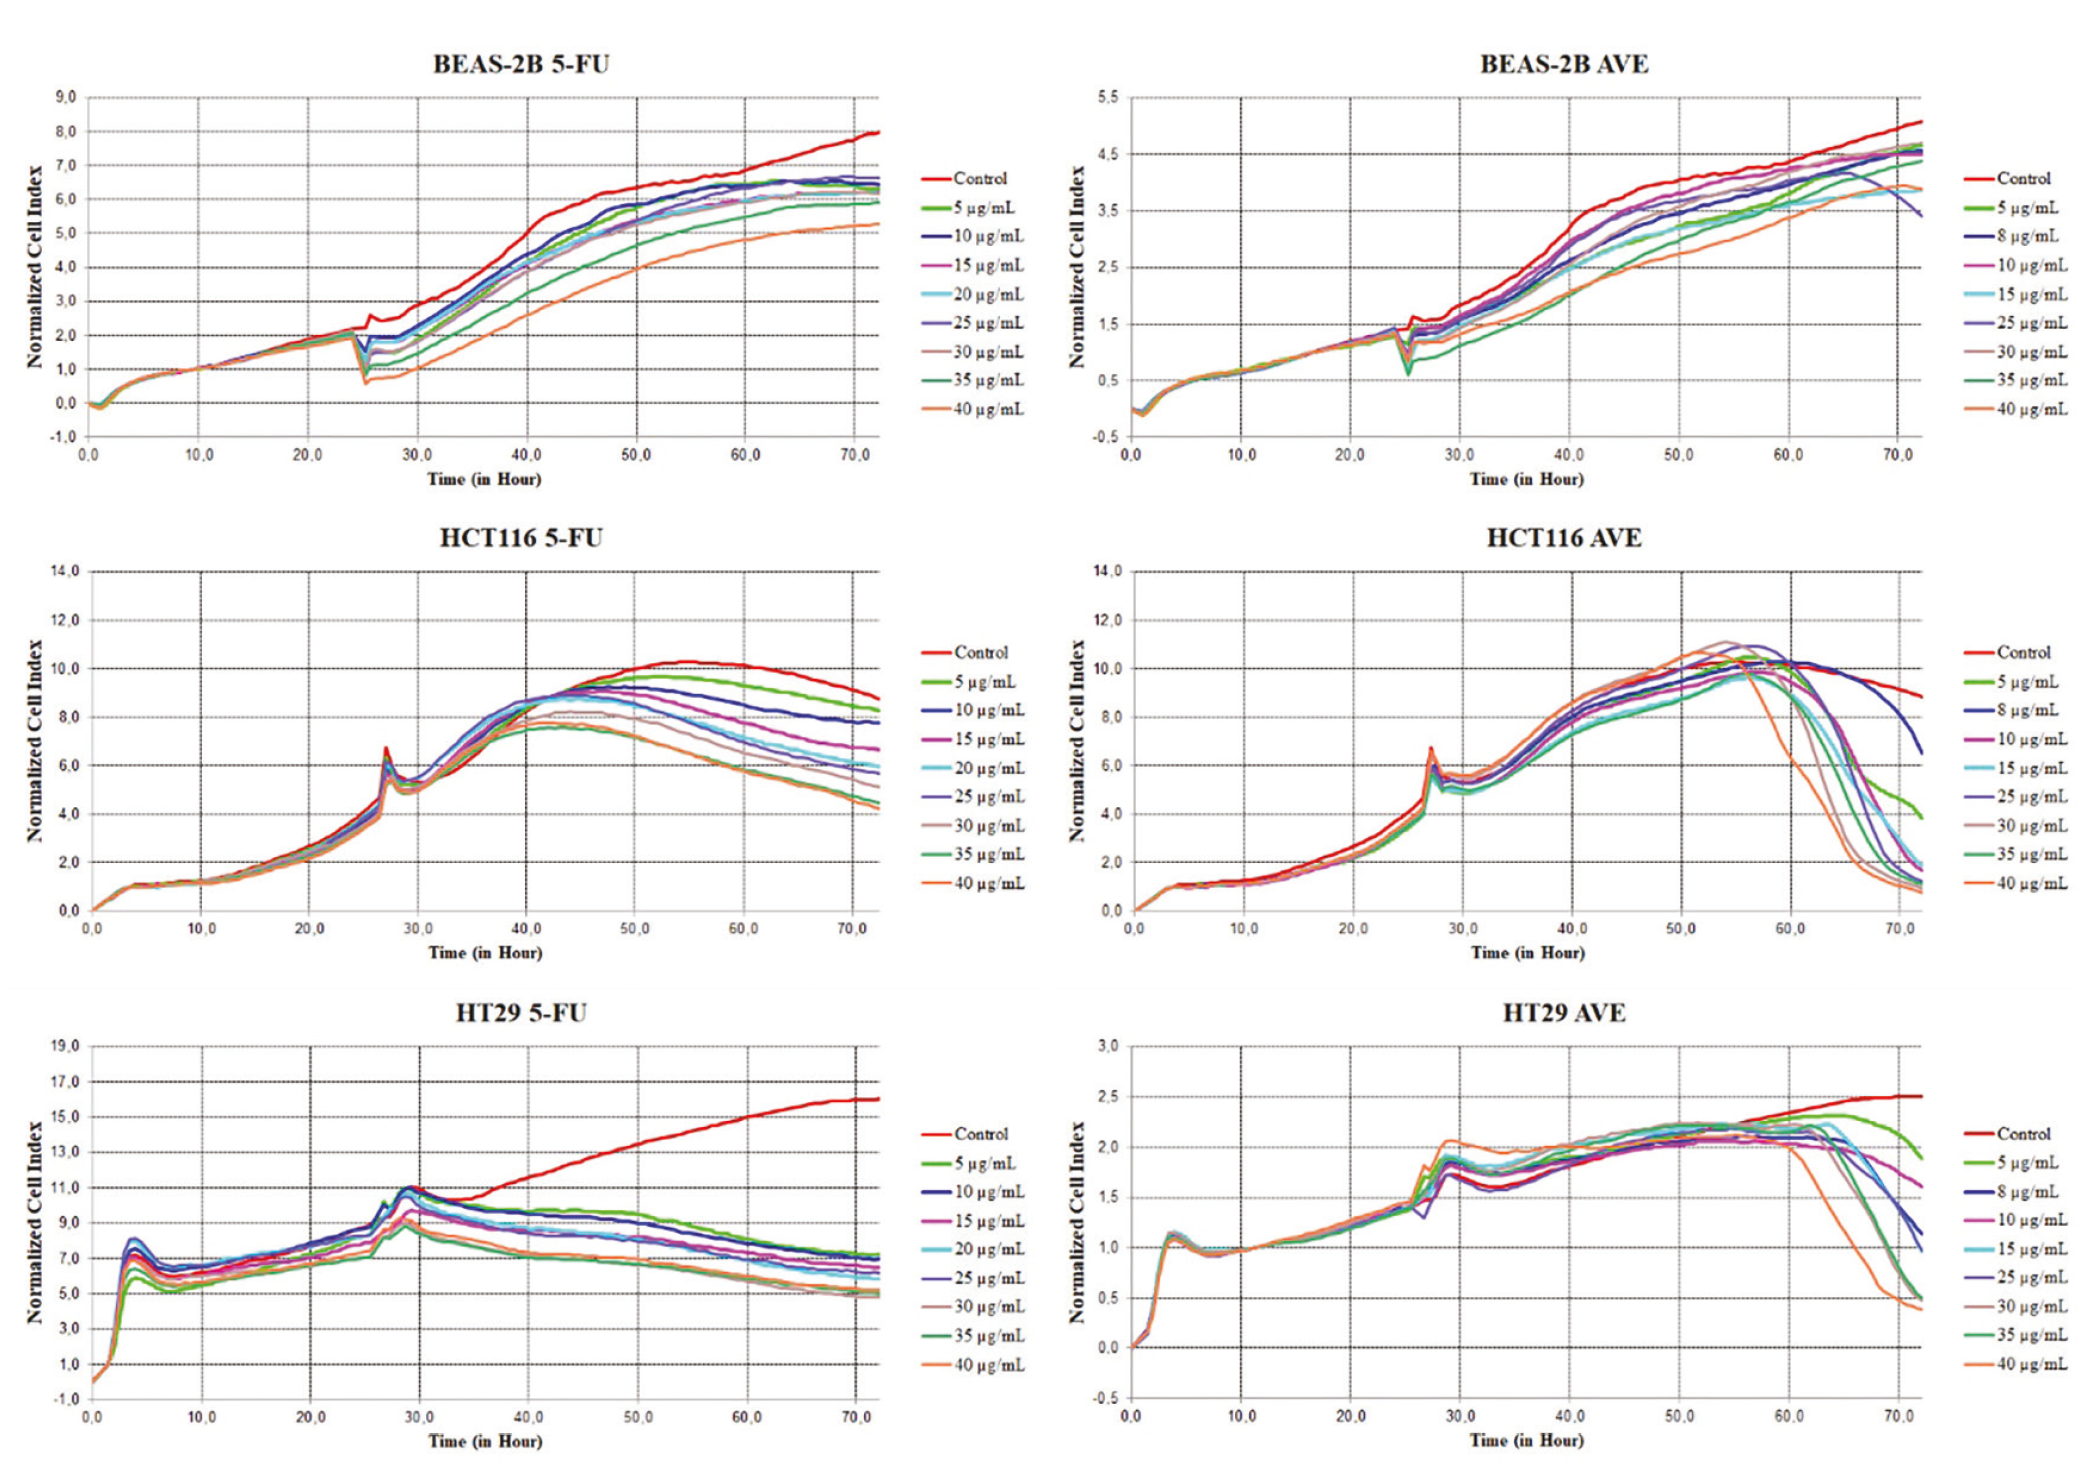
The data presented in demonstrate the time- and dose-dependent antiproliferative effects of 5-FU and AVE on BEAS-2B, HCT116, and HT29 cell lines, as measured by normalized CI over a 70-h period. Both compounds showed clear concentration-dependent responses, with higher doses (25-40 µg/mL) causing more pronounced inhibition of cell proliferation in all cell types. Notably, AVE exhibited robust cytotoxic activity against HT29 cells, resulting in rapid decreases in CI even at low concentrations (10 µg/mL) (p < 0.05). Differences in responses among the cell lines were striking, with normal BEAS-2B cells showing greater sensitivity to AVE than to 5-FU, which suggests potential toxicity concerns for normal tissues. In contrast, HCT116 carcinoma cells showed intermediate sensitivity to both compounds; AVE produced a more rapid response than 5-FU (p < 0.05). The results revealed that significant antiproliferative effects typically became apparent 24-48 hours after treatment, consistent with mechanisms involving cell-cycle arrest or the induction of apoptosis. These findings suggest that, although AVE may offer advantages over 5-FU in terms of potency against certain cancer cell types—particularly the HT29 adenocarcinoma line—its significant toxicity to normal cells may limit its therapeutic window.
Analysis of Oxygen Consumption in HCT116 and HT29 Cells Using the Cell Mito Stress Test
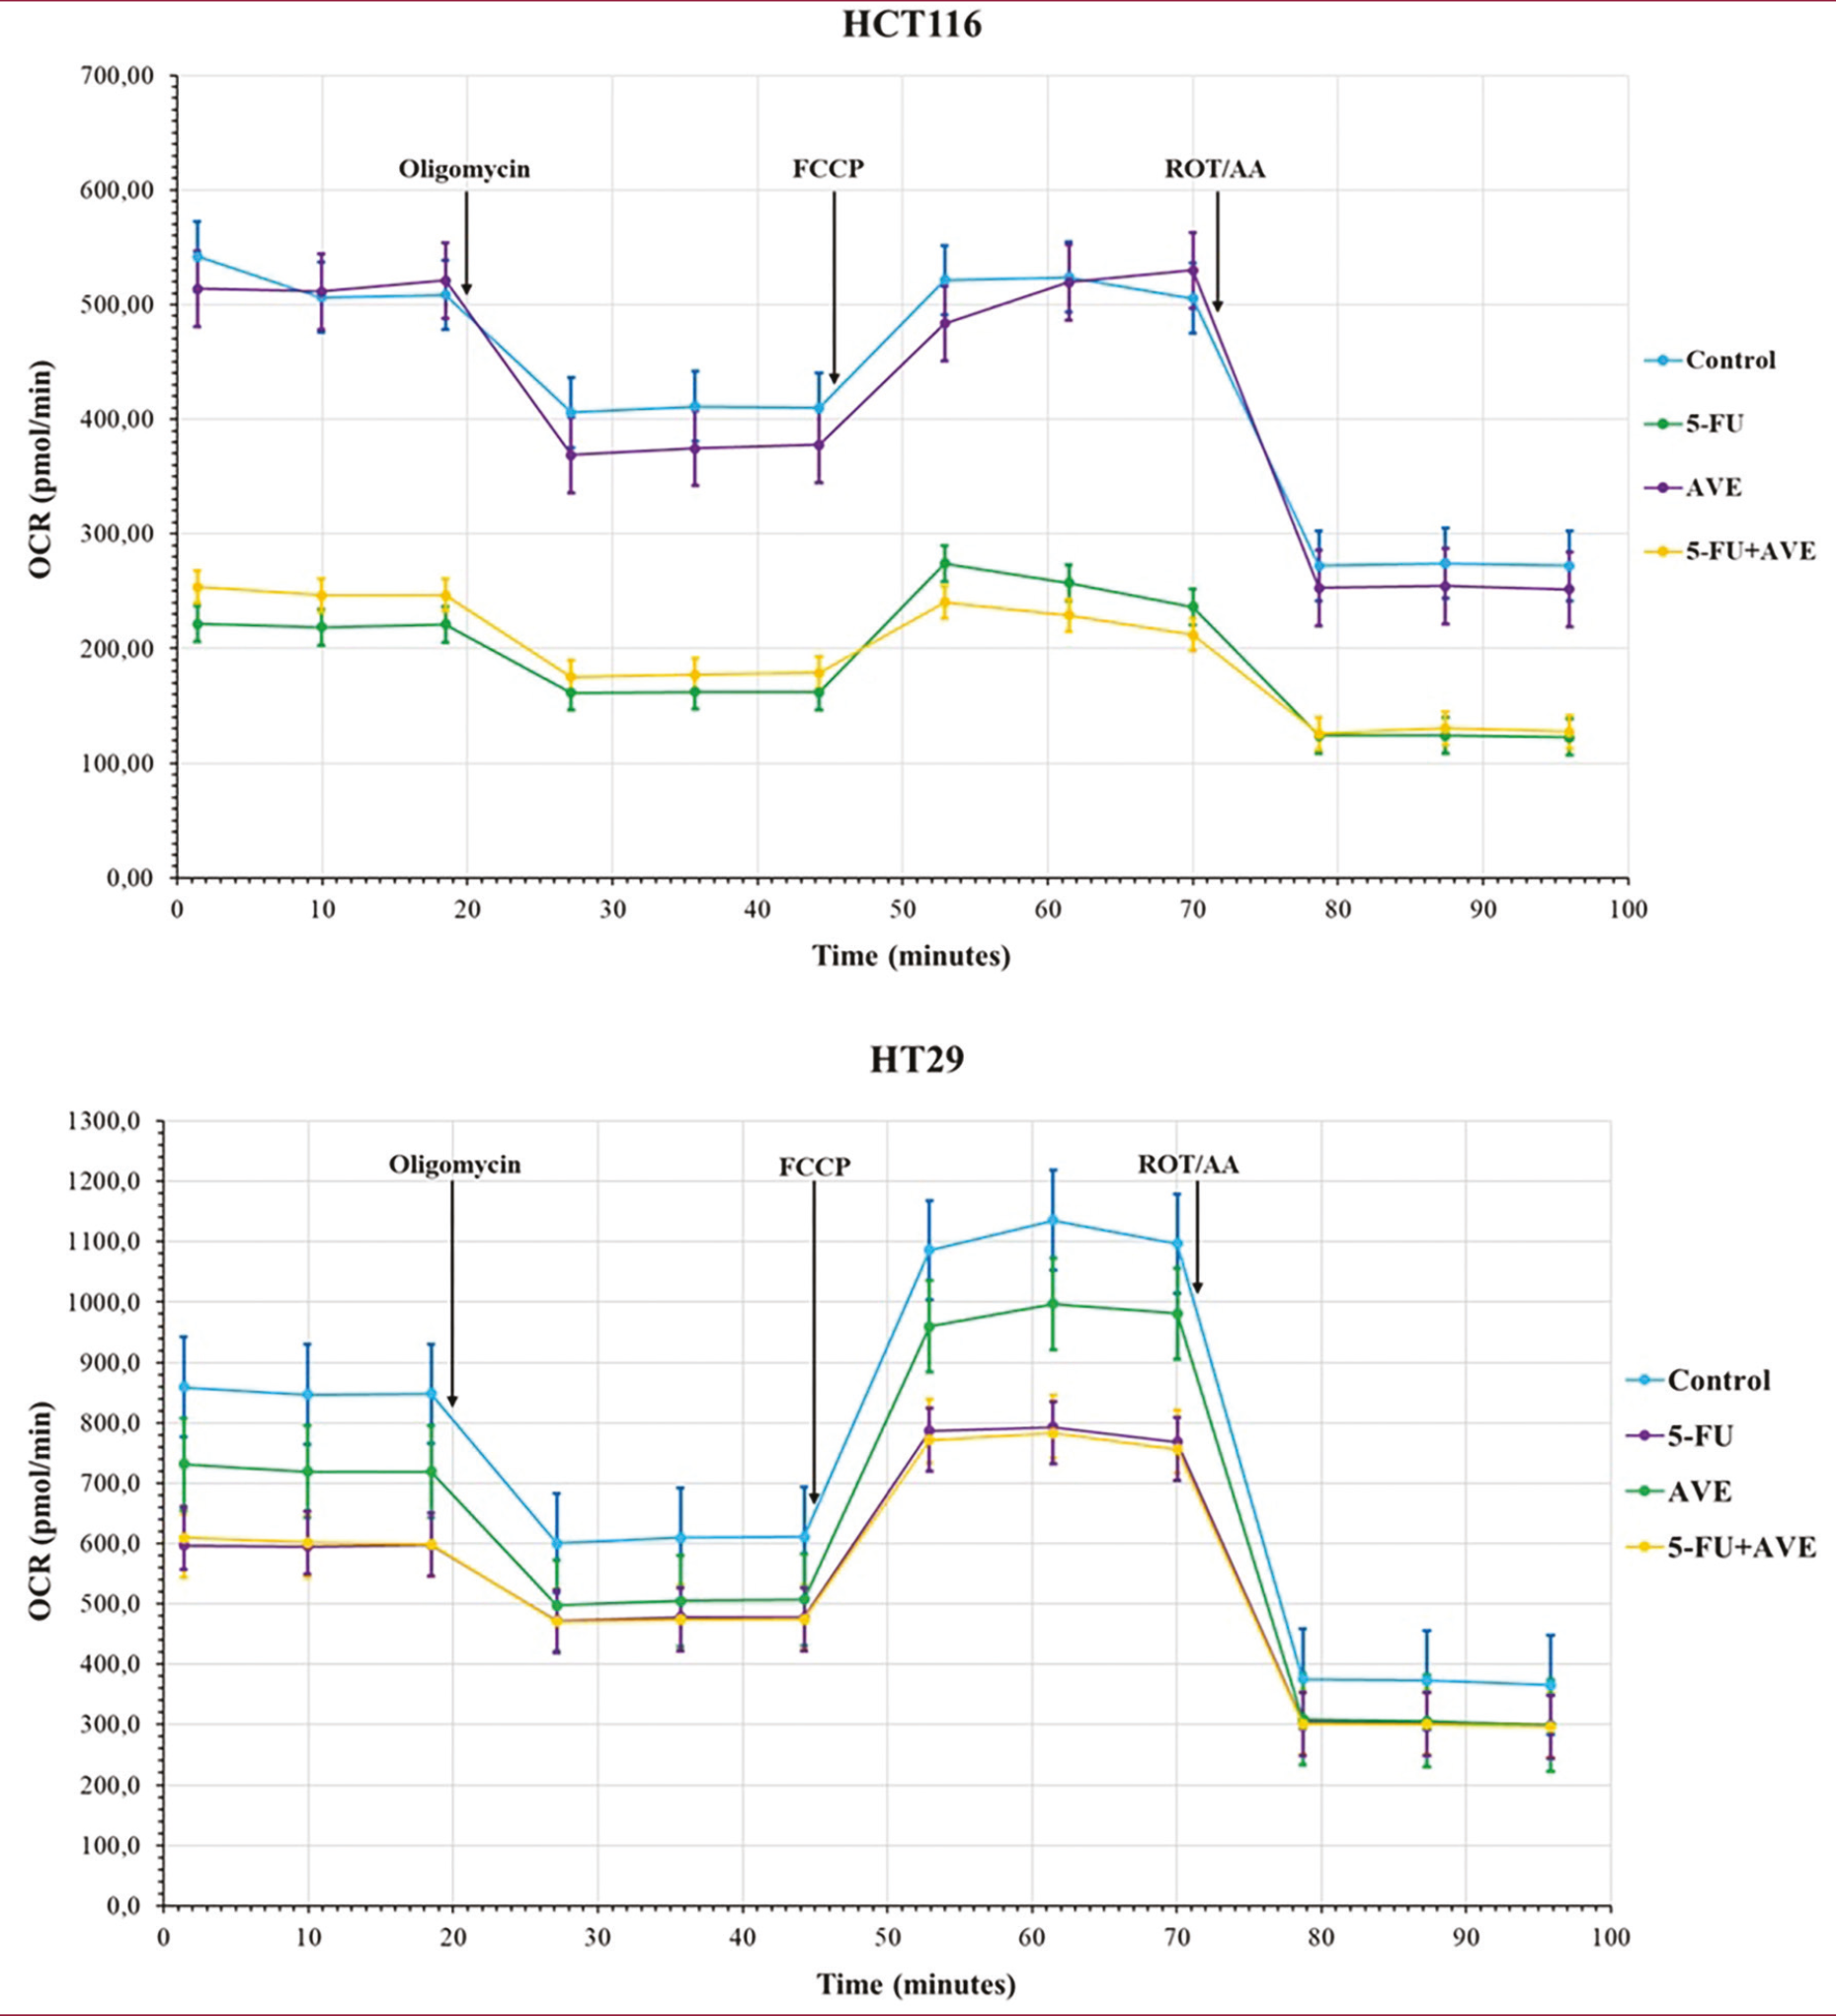
The metabolic activity of HCT116 and HT29 colon cancer cells was assessed using a mitochondrial stress test to evaluate the effects of 5-FU, AVE, and their combination (5-FU+AVE), along with control treatments. The main modulators, oligomycin (an ATP synthase inhibitor), FCCP (a mitochondrial uncoupler), and rotenone/antimycin A (Rot/AA; electron transport chain inhibitors), were used to examine mitochondrial function. Real-time measurements of metabolic parameters in HCT116 and HT29 cells, recorded over a time course, potentially reflect the oxygen consumption rate (OCR). shows the comparative analysis of mitochondrial respiratory dynamics in HCT116 cells treated with 5-FU, AVE, and 5-FuAve, measured by real-time OCR. While the control group exhibited a baseline metabolic profile, the 5-FU treatment caused a significant decrease in OCR (p < 0.05), indicating impaired mitochondrial function. This phenomenon is consistent with the known role of 5-FU in disrupting pyrimidine metabolism and inducing oxidative stress. In contrast, AVE alone shows a distinct metabolic signature, potentially suggesting modulation of alternative pathways unrelated to the mechanism of 5-FU. The 5-FuAve treatment demonstrates a combined effect that may reflect increased cytotoxicity or modulation of drug-resistance mechanisms, as evidenced by a significant deviation from the additive effects of individual treatments.
Identification and Functional Enrichment of Differentially Expressed Genes and Comparative Transcriptomic Analysis
Transcriptome analysis identified 622 DEGs in HCT116 and 74 DEGs in HT29 cells with log2FC values below -2.0 or above 2.0, meeting the significance thresholds of p < 0.05 and FDR-adjusted p value <0.05. Among these, 524 genes were upregulated, while 98 were downregulated in HCT116 cells and 57 upregulated genes and 17 downregulated genes in HT29 cells, respectively ( and ). The top 10 up- and downregulated genes in HCT116 and HT29 cells are given in and c, respectively. As shown in , seven genes are upregulated and three genes are downregulated in both HCT116 and HT29 cells, while one gene is upregulated in HCT116 but downregulated in HT29 (). Further analyses were carried out to gain deeper insight into the functional significance of these DEGs. GO enrichment analysis was performed to determine the related biological processes, cellular components, and molecular functions (, ). In HCT116 cells, the GO terms epidermis development, wound healing, fat-soluble vitamin metabolic process, regulation of body fluid levels, establishment of skin barrier, multicellular organismal water homeostasis, sensory system development, cellular response to xenobiotic stimulus, regulation of water loss via skin and negative regulation of cell adhesion were identified as the most significant biological processes (, ). The most significant molecular functions were: extracellular matrix structural constituent; iron ion binding; extracellular matrix structural constituent conferring tensile strength; heme binding; integrin binding; tetrapyrrole binding; cargo receptor activity; tumor necrosis factor (TNF)-activated receptor activity; quaternary ammonium group transmembrane transporter activity; and death receptor activity.
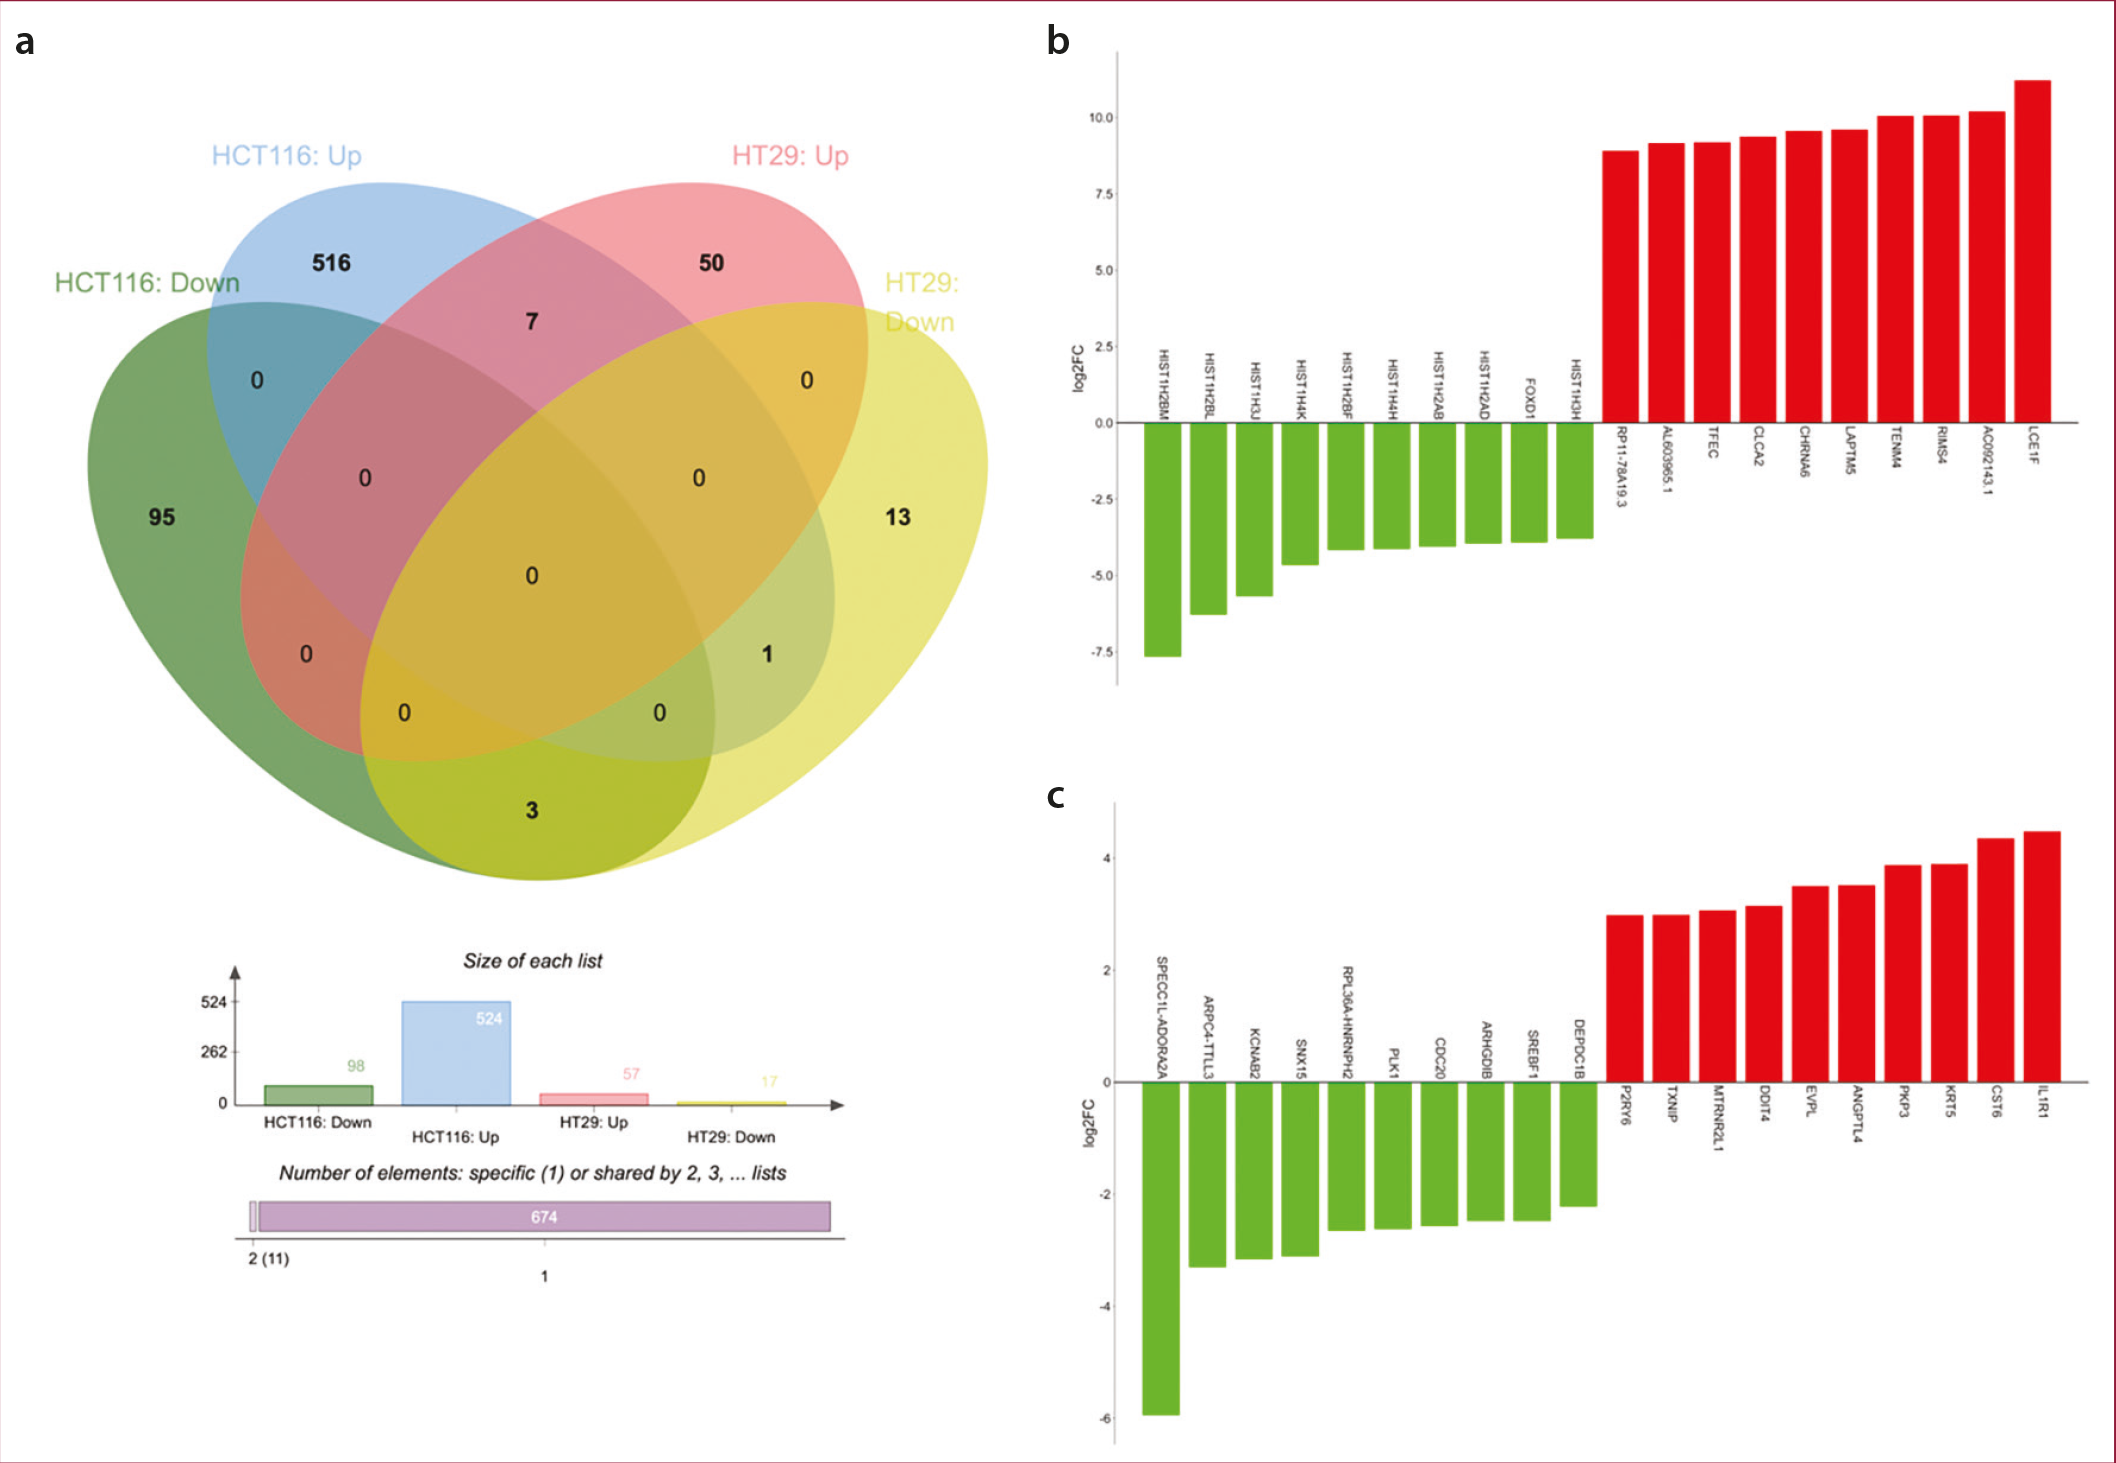
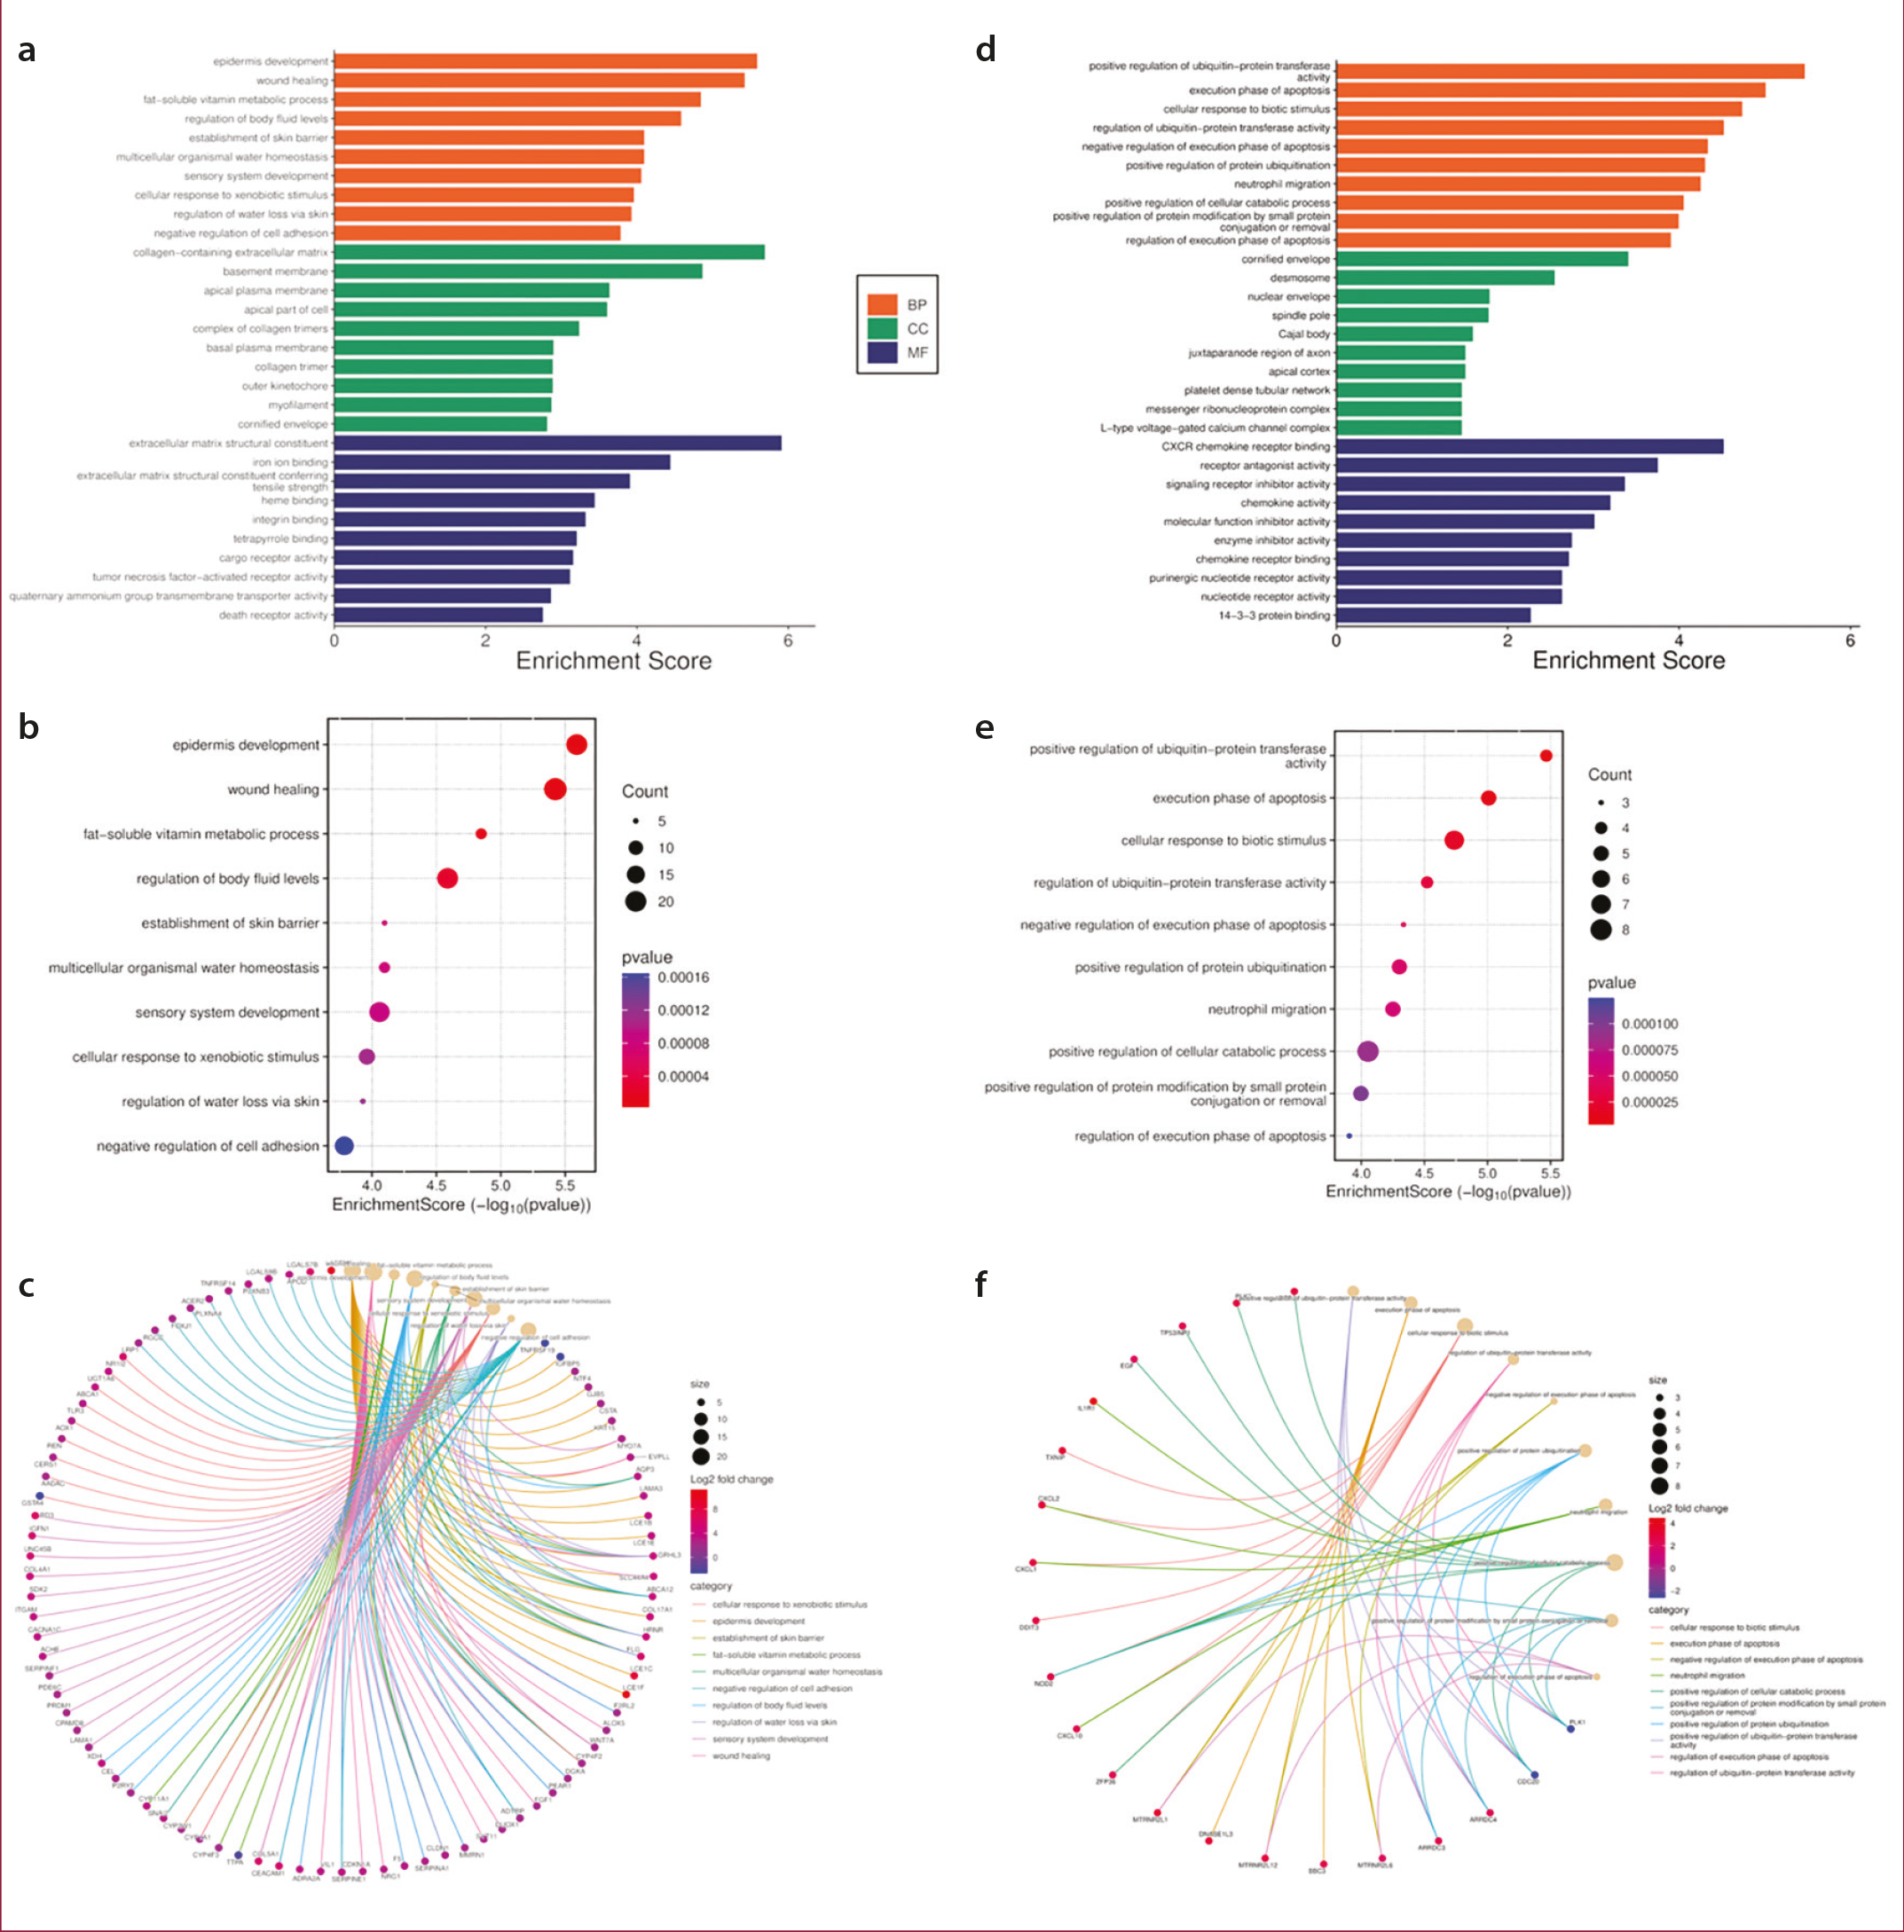
Table 1. Shared DEGs between HCT116 and HT29 cells: Seven upregulated and three downregulated genes in both cell lines, with one gene showing opposite regulation–upregulated in HCT116 and downregulated in HT29.
- | HCT116 | HT29 | ||||
|---|---|---|---|---|---|---|
Gene | log2(FC) | FC | FDR p value | log2(FC) | FC | FDR p value |
Upregulated in both HCT116 and HT29 | ||||||
Fibulin 2 (FBLN2) | 3,20356815 | 9,21234313 | 0,00868210 | 2,528234515 | 5,768653124 | 4,614E-09 |
Inositol polyphosphate-5-phosphatase D (INPP5D) | 3,19173167 | 9,13707037 | 5,7686E-44 | 2,158557855 | 4,464683339 | 6,4709E-05 |
Tumor protein P53 inducible nuclear protein 1 (TP53INP1) | 2,62392613 | 6,16425324 | 2,6702E-97 | 2,318983623 | 4,989805645 | 1,5887E-45 |
Growth arrest and DNA damage inducible gamma (GADD45G) | 2,4505412 | 5,46621118 | 0,0001527 | 2,065574394 | 4,186006042 | 1,4593E-20 |
BTG anti-proliferation factor 2 (BTG2) | 2,35905509 | 5,13034231 | 4,93E-79 | 2,792143852 | 6,926583143 | 5,1184E-55 |
Autophagy related 9B (ATG9B) | 2,04334135 | 4,12199099 | 2,685E-15 | 2,817766923 | 7,050702085 | 4,3725E-12 |
Activating transcription factor 3 (ATF3) | 2,00429816 | 4,0119348 | 6,319E-40 | 2,659183629 | 6,31675505 | 0,00018333 |
Upregulated in HCT116, but downregulated in HT29 | ||||||
Cystathionine beta-synthase (CBS) | 6,2167376 | 74,374575 | 5,879E-20 | -2,02060616 | -4,05754238 | 0,00078347 |
Downregulated in both HCT116 and HT29 | ||||||
Polo like kinase 1 (PLK1) | -2,8950775 | -7,4388389 | 1,9315E-94 | -2,6207406 | -6,1506572 | 1,1588E-58 |
PIF1 5’-To-3’ DNA helicase (PIF1) | -2,4748359 | -5,5590405 | 4,9468E-24 | -2,0221970 | -4,0620191 | 5,68E-06 |
Cell division cycle 20 (CDC20) | -2,306965 | -4,9484086 | 3,1262E-70 | -2,5681318 | -5,9304098 | 4,8107E-58 |
DEG, differentially expressed gene; FC, fold change; FDR, false discovery rate.
In HT29 cells, the GO terms positive regulation of ubiquitin-protein transferase activity; execution phase of apoptosis; cellular response to biotic stimulus; regulation of ubiquitin-protein transferase activity; negative regulation of execution phase of apoptosis; positive regulation of protein ubiquitination; neutrophil migration; positive regulation of cellular catabolic process; positive regulation of protein modification by small protein conjugation or removal; and regulation of execution phase of apoptosis were identified as the most significant biological processes (, ).
The most significant molecular functions were: CXCR chemokine receptor binding, receptor antagonist activity, signaling receptor inhibitor activity, chemokine activity, molecular function inhibitor activity, enzyme inhibitor activity, chemokine receptor binding, purinergic nucleotide receptor activity, nucleotide receptor activity, and 14-3-3 protein binding. Additionally, pathway analysis was used to examine the signaling pathways affected by the identified DEGs in both HCT116 and HT29 cells. In HCT116 cells, the 10 most significant deregulated pathways were identified as p53 signaling pathway, arachidonic acid metabolism, amoebiasis, cytoskeleton in muscle cells, renin secretion, Ovarian steroidogenesis, Complement and coagulation cascades, Oocyte meiosis, Calcium signaling pathway, and Melanoma (, ). In HT29 cells, NF-kappa B signaling pathway, FoxO signaling pathway, CRC, mitogen-activated protein kinase (MAPK) signaling pathway, TNF signaling pathway, endometrial cancer, apoptosis, non-small cell lung cancer, Melanoma and p53 signaling pathway were the 10 most significant deregulated pathways (, ).
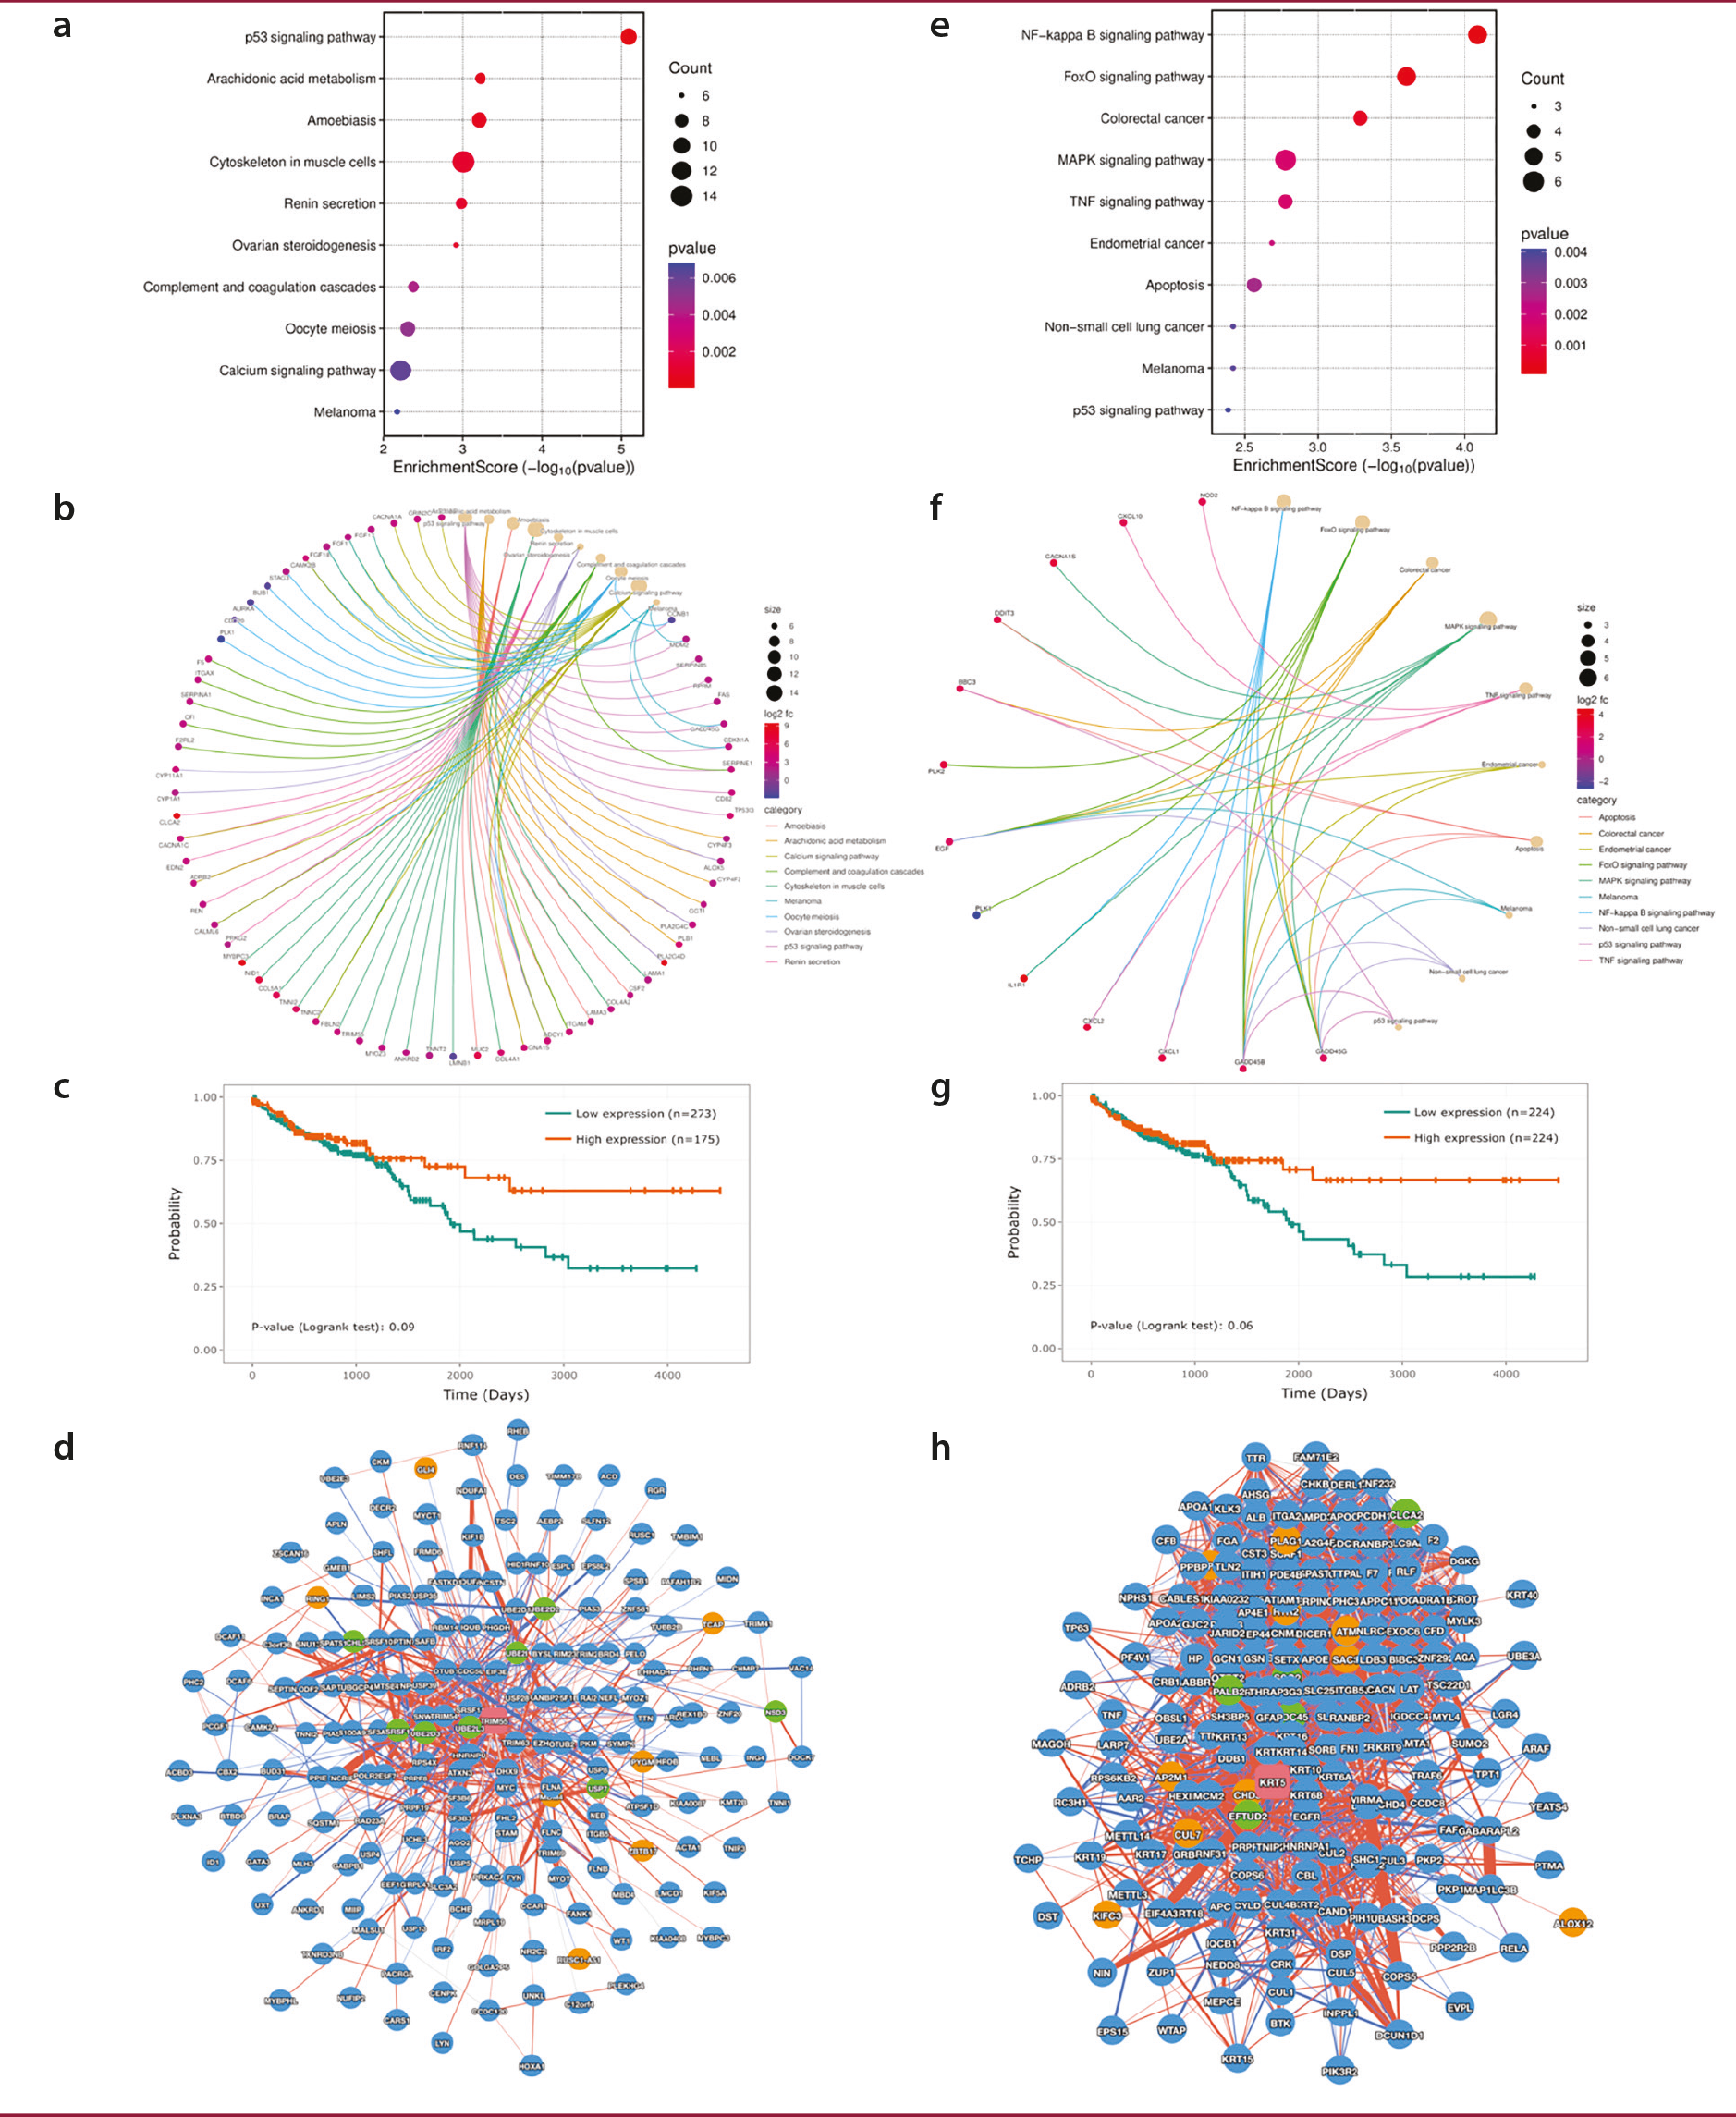
Kaplan-Meier survival analysis was performed using the PINA v3.0 platform to compare the DEGs identified in our study with those from TCGA-COAD. Patients were stratified into two groups based on the expression levels of the upregulated genes TRIM55 [log2(FC) = 2.792066173, FDR-adjusted p value = 0.028605512] in HCT116 cells and KRT5 [log2(FC) = 3.89602477738263, FDR-adjusted p value = 0.036933788] in HT29 cells (top 50% vs. bottom 50%), and OS was assessed. The analysis revealed that high expression of the genes TRIM55 and KRT5 was linked to better OS (, ). The protein-protein interaction networks of TRIM55 and KRT5 showed that while TRIM55 had 250 interactors with 1,135 interactions, KRT5 had 201 interactors and 4,334 interactions (, ).
Discussion
The current study demonstrates that the combination of 5-FU and AVE, extract (5-FuAve) exerts potent antitumor effects on CRC cells, albeit through distinct, cell-line-specific molecular mechanisms. Real-time proliferation assays, mitochondrial stress analyses, and transcriptome profiling demonstrate that 5-FuAve effectively suppresses cell proliferation, impairs mitochondrial respiration, and regulates key oncogenic and tumor-suppressor pathways in both the HCT116 and HT29 cell lines. Post-treatment transcriptional analysis revealed a significant increase in the expression of tumor suppressor genes common to both cell lines. The coordinated upregulation of FBLN2, INPP5D, TP53INP1, GADD45G, BTG2, and ATF3 is consistent with the potential activation of anti-proliferative, pro-apoptotic, and DNA damage response pathways (-). Simultaneous downregulation of critical oncogenic regulators such as PLK1 and CDC20 (-) further underscores the multi-targeted efficacy of the 5-FuAve combination. This coordinated upregulation of opposing genetic networks effectively shifts the cellular balance away from proliferation and survival toward growth arrest and cell death. Notably, despite these common gene expression changes, our pathway enrichment analysis uncovered divergent mechanistic routes to cell death in the two CRC models. In HT29 cells, the significant enrichment of the MAPK, TNF, and apoptosis pathways is consistent with a putative mechanism of cell death associated with apoptosis. This is consistent with the role of genes such as GADD45G in the observed metabolic collapse. Conversely, in HCT116 cells, the prominent enrichment of the arachidonic acid metabolism pathway, coupled with the marked upregulation of ALOX5, provides transcriptomic evidence suggestive of a potential ferroptotic response—an iron-dependent form of cell death driven by lipid peroxidation (). The upregulation of MDM2 in HCT116 cells, a negative regulator of p53, may explain the lack of significant apoptosis pathway enrichment in this cell line, suggesting potential impairment of p53-mediated apoptosis that is compensated for by the activation of this alternative death pathway. A critical and paradoxical finding was the differential regulation of cystathionine beta-synthase (CBS). Its downregulation in HT29 cells aligns with its established pro-tumorigenic role in CRC (, ) representing a beneficial therapeutic outcome. However, its upregulation in HCT116 cells warrants careful interpretation. This may indicate a stress-induced adaptive response or a cell line-specific resistance mechanism, either of which could mitigate treatment efficacy, highlighting the need for caution and further investigation. Ultimately, the convergence of these distinct molecular mechanisms— apoptosis in HT29 and a putative ferroptotic pathway in HCT116—resulted in comparable phenotypic outcomes: suppressed proliferation and cell death. This suggests that 5-FuAve possesses the versatility to target heterogeneous CRC populations through multiple modalities, thereby potentially addressing the common challenge of resistance to single-agent therapies. BEAS-2B cells are of bronchial epithelial origin and do not represent normal colonic epithelium, which is a limitation of the current study. The toxicity observed in BEAS-2B cells may reflect the broad bioactivity of AVE's phytochemical constituents rather than a lack of tumor-cell specificity per se. Future studies employing normal colon epithelial cell lines, such as NCM460 or CCD841CoN, are planned to calculate a formal selectivity index and to more comprehensively assess the tissue-specific safety profile of the 5-FuAve combination.
Study Limitations
This suggests that the combination therapy may engage diverse pathways depending on the cellular context, highlighting the complexity of drug responses in heterogeneous tumor types. However, this study has several limitations. Notably, RNA sequencing was performed exclusively on the control and combination treatment (5-FuAve) groups; single-agent sequencing groups (5-FU alone or AVE alone) were not included. This restricts the ability to delineate the individual transcriptomic contributions of each agent and to distinguish their specific effects from those arising from their interaction or non-specific cytotoxicity. Future studies should include treatment groups receiving each agent alone, followed by comparable sequencing analyses, to better understand their independent and combined molecular impacts. Despite these limitations, the current work provides valuable insights into the differential responses of CRC cells to combination therapy with 5-FuAve and underscores the need for tailored therapeutic approaches. Furthermore, the proposed apoptotic and ferroptotic mechanisms are based on transcriptomic evidence and pathway enrichment analyses: direct validation assays such as caspase-3/7 activation and Annexin V/PI flow cytometry for apoptosis, and lipid peroxidation measurement and GPX4 protein expression analysis for ferroptosis were not performed in this study and are planned as priority objectives for future investigations.
Conclusion
This study demonstrates that the combination of 5-FU with Aloe vera extract (5-FuAve) induces distinct but comparably potent transcriptomic alterations in the CRC cell lines HCT116 and HT29. While HT29 cells display transcriptomic features consistent with a putative apoptotic response, HCT116 cells appear to compensate for an attenuated apoptotic response via a potential ferroptosis-associated pathway. Several commonly upregulated genes, including FBLN2, INPP5D, TP53INP1, and GADD45G, suggest that 5-FuAve treatment induces a core tumor-suppressive signature. Notably, context-dependent gene responses, such as the divergent regulation of CBS and the differential engagement of the p53 signaling pathway, highlight the complexity of cellular responses shaped by tumor-specific molecular landscapes. By concurrently activating tumor suppressors, suppressing oncogenes, and engaging cell type-specific death pathways, this combination therapy provides preliminary in vitro evidence that it can address certain limitations of 5-FU monotherapy, pending validation in more complex experimental models.
Footnotes
Ethics
Ethics Committee Approval: This study does not require ethical committee approval because it does not involve human or animal subjects and is based solely on commercially purchased cell lines.
Informed Consent: Not applicable, as the study did not involve human participants and was based solely on commercially purchased cell lines.
Conflict of Interest: No conflict of interest was declared by the author.
Financial Disclosure: The author declared that this study received no financial support.
References
Morgan E, Arnold M, Gini A, Lorenzoni V, Cabasag CJ, Laversanne M, et al. Global burden of colorectal cancer in 2020 and 2040: incidence and mortality estimates from GLOBOCAN. Gut. 2023;72:338-344.
Klimeck L, Heisser T, Hoffmeister M, Brenner H. Colorectal cancer: a health and economic problem. Best Pract Res Clin Gastroenterol. 2023;66:101839.
Haynes J, Manogaran P. Mechanisms and Strategies to overcome drug resistance in colorectal cancer. Int J Mol Sci. 2025;26:1988.
Wang Q, Shen X, Chen G, Du J. Drug resistance in colorectal cancer: from mechanism to clinic. Cancers (Basel). 2022;14:2928.
Cho YH, Ro EJ, Yoon JS, Mizutani T, Kang DW, Park JC, et al. 5-FU promotes stemness of colorectal cancer via p53-mediated WNT/β-catenin pathway activation. Nat Commun. 2020;11(1):5321.
Vodenkova S, Buchler T, Cervena K, Veskrnova V, Vodicka P, Vymetalkova V. 5-fluorouracil and other fluoropyrimidines in colorectal cancer: past, present and future. Pharmacol Ther. 2020;206:107447.
Takagi K, Sowa Y, Cevik OM, Nakanishi R, Sakai T. CDK inhibitor enhances the sensitivity to 5-fluorouracil in colorectal cancer cells. Int J Oncol. 2008;32:1105-1110.
Mafi A, Rezaee M, Hedayati N, Hogan SD, Reiter RJ, Aarabi MH, et al. Melatonin and 5-fluorouracil combination chemotherapy: opportunities and efficacy in cancer therapy. Cell Commun Signal. 2023;21:33.
Sethy C, Kundu CN. 5-Fluorouracil (5-FU) resistance and the new strategy to enhance the sensitivity against cancer: Implication of DNA repair inhibition. Biomed Pharmacother. 2021;137:111285.
Gu J, Li Z, Zhou J, Sun Z, Bai C. Response prediction to oxaliplatin plus 5-fluorouracil chemotherapy in patients with colorectal cancer using a four-protein immunohistochemical model. Oncol Lett. 2019;18:2091-2101.
Papanastasopoulos P, Stebbing J. Molecular basis of 5-fluorouracil-related toxicity: lessons from clinical practice. Anticancer Res. 2014;34:1531-1535.
Tournigand C, André T, Achille E, Lledo G, Flesh M, Mery-Mignard D, et al. FOLFIRI followed by FOLFOX6 or the reverse sequence in advanced colorectal cancer: a randomized GERCOR study. J Clin Oncol. 2004;22:229-237.
Dlott AH, Spencer SA, Di Pasqua AJ. Calcipotriol and 5-fluorouracil combination therapy for the treatment of actinic keratosis in the clinic: a review article. Clin Drug Investig. 2024;44:733-737.
Ndreshkjana B, Çapci A, Klein V, Chanvorachote P, Muenzner JK, Huebner K, et al. Combination of 5-fluorouracil and thymoquinone targets stem cell gene signature in colorectal cancer cells. Cell Death Dis. 2019;10:379.
Wang F, Dai W, Wang Y, Shen M, Chen K, Cheng P, et al. The synergistic in vitro and in vivo antitumor effect of combination therapy with salinomycin and 5-fluorouracil against hepatocellular carcinoma. PLoS One. 2014;9:e97414.
Grivicich I, Regner A, da Rocha AB, Grasso LB, Alves PAG, Kayser GB, et al. Irinotecan/5-fluorouracil combination induces alterations in mitochondrial membrane potential and caspases on colon cancer cell lines. Oncol Res. 2005;15:385-392.
Wei Y, Yang P, Cao S, Zhao L. The combination of curcumin and 5-fluorouracil in cancer therapy. Arch Pharm Res. 2018;41:1-13.
Kuo PL, Lin TC, Lin CC. The antiproliferative activity of aloe-emodin is through p53-dependent and p21-dependent apoptotic pathway in human hepatoma cell lines. Life Sci. 2002;71:1879-1892.
Tong X, Li M, Li D, Lao C, Chen J, Xu W, et al. Aloe vera gel extract: safety evaluation for acute and chronic oral administration in Sprague-Dawley rats and anticancer activity in breast and lung cancer cells. J Ethnopharmacol. 2021;280:114434.
Wan L, Zhang L, Fan K, Wang J. Aloin promotes A549 cell apoptosis via the reactive oxygen speciesmitogen activated protein kinase signaling pathway and p53 phosphorylation. Mol Med Rep. 2017;16:5759-5768.
El-Shemy HA, Aboul-Soud MA, Nassr-Allah AA, Aboul-Enein KM, Kabash A, Yagi A. Antitumor properties and modulation of antioxidant enzymes’ activity by Aloe vera leaf active principles isolated via supercritical carbon dioxide extraction. Curr Med Chem. 2010;17:129-138.
Kumar R, Singh AK, Gupta A, Bishayee A, Pandey AK. Therapeutic potential of Aloe vera-A miracle gift of nature. Phytomedicine. 2019;60:152996.
Barbosa R, Villarreal A, Rodriguez C, De Leon H, Gilkerson R, Lozano K. Aloe Vera extract-based composite nanofibers for wound dressing applications. Mater Sci Eng C Mater Biol Appl. 2021;124:112061.
Jia Y, Zhao G, Jia J. Preliminary evaluation: the effects of Aloe ferox Miller and Aloe arborescens Miller on wound healing. J Ethnopharmacol. 2008;120:181-189.
Tang D, Chen M, Huang X, Zhang G, Zeng L, Zhang G, et al. SRplot: a free online platform for data visualization and graphing. PLoS One. 2023;18:e0294236.
Du Y, Cai M, Xing X, Ji J, Yang E, Wu J. PINA 3.0: mining cancer interactome. Nucleic Acids Res. 2021;49:D1351-D1357.
Zhang H, Hui D, Fu X. Roles of fibulin-2 in carcinogenesis. Med Sci Monit. 2020;26:e918099.
Ma Y, Nenkov M, Schröder DC, Abubrig M, Gassler N, Chen Y. Fibulin 2 is hypermethylated and suppresses tumor cell proliferation through inhibition of cell adhesion and extracellular matrix genes in non-small cell lung cancer. Int J Mol Sci. 2021;22:11834. doi
Law EW, Cheung AK, Kashuba VI, Pavlova TV, Zabarovsky ER, Lung HL, et al. Anti-angiogenic and tumor-suppressive roles of candidate tumor-suppressor gene, fibulin-2, in nasopharyngeal carcinoma. Oncogene. 2012;31:728-738.
Ma H, Lian C, Song Y. Fibulin-2 inhibits development of gastric cancer by downregulating β-catenin. Oncol Lett. 2019;18:2799-2804.
Lim J, Hwang YS, Yoon HR, Yoo J, Yoon SR, Jung H, et al. PLK1 phosphorylates RhoGDI1 and promotes cancer cell migration and invasion. Cancer Cell Int. 2024;24:73.
Wu F, Sun Y, Chen J, Li H, Yao K, Liu Y, et al. The oncogenic role of APC/C activator protein Cdc20 by an integrated pan-cancer analysis in human tumors. Front Oncol. 2021;11:721797.
Tang D, Chen X, Kang R, Kroemer G. Ferroptosis: molecular mechanisms and health implications. Cell Res. 2021;31:107-125.
Coletta C, Chao C, Módis K, Papapetropoulos A, Hellmich M, Szabo C. OP17: cystathionine-β-synthase (CBS) is upregulated in colorectal cancer cells and promotes their proliferation. Nitric Oxide. 2013;31:S26-S27.
Ascenção K, Szabo C. Emerging roles of cystathionine β-synthase in various forms of cancer. Redox Biol. 2022;53:102331.
Supplementary Materials
Supplementary Data 1
Download