
Abstract
Background
Prostate cancer is one of the most common and lethal malignancies among men worldwide, making accurate risk prediction tools essential for early diagnosis and personalized care. This study aimed to compare the predictive ability of traditional binary logistic regression with machine learning (ML) algorithms, including support vector machines (SVM), K-nearest neighbors (KNN), chi-squared automatic interaction detection (CHAID), and C5.0, in identifying key risk factors and classifying prostate cancer status.
Materials and Methods
The study included 501 male participants (248 diagnosed cases and 253 controls) who completed a structured 20-item questionnaire covering demographic, clinical, and lifestyle characteristics.
Results
Age, smoking status, and family history of cancer consistently emerged as significant predictors across models. Additional indicators included blood in semen or urine, frequency of urination, and daily activity level. Logistic regression achieved the highest accuracy (92.2%), followed by CHAID (91.36%), SVM (89.92%), KNN (88.48%), and C5.0 (88%).
Conclusion
Logistic regression provided the best accuracy and interpretability for structured clinical data, while ML models offered complementary insights by identifying complex, nonlinear associations.
Keywords: Prostate cancer, risk prediction, logistic regression, machine learning, classification algorithms
Introduction
Regression models are fundamental statistical tools used to examine the relationships between dependent and independent variables. These models require different assumptions depending on the structure of the data and the characteristics of the variables. In this context, logistic regression (LR) is a widely used, powerful, and flexible method for analyzing binary outcome variables (, ).
One of the main advantages of LR is that it is not strictly bound by classical parametric assumptions such as normal distribution, linear relationships, or homogeneity of variances (, ). This makes it highly reliable in fields such as clinical research, where complex data structures are common (). Moreover, LR allows for the simultaneous evaluation of multiple independent variables and enables statistical testing of their individual and combined effects on the dependent variable ().
In recent years, the increasing computational power and accessibility of large datasets have brought machine learning (ML) techniques to the forefront as alternatives to traditional statistical methods. First introduced in the 1950s, ML encompasses mathematical models that enable computers to learn from data and make predictions (). Today, ML algorithms are widely used across various disciplines, including finance, engineering, and healthcare, due to their high accuracy, flexibility, and modeling capacity (, ).
ML is generally categorized into supervised, unsupervised, and semi-supervised learning approaches (, ). Supervised learning is applied when the outcome variable in the dataset is known and includes methods such as support vector machines (SVM), decision trees, and classification algorithms. Unsupervised learning aims to uncover hidden patterns or groupings in the data without any labeled outcome variable. Semi-supervised learning, on the other hand, is a hybrid model that utilizes both labeled and unlabeled data ().
Today, the increasing volume and complexity of clinical data-especially in multifactorial diseases such as cancer-have created a need for more effective tools for risk prediction. Accordingly, ML algorithms have become valuable tools in healthcare for early diagnosis, treatment planning, and personalized medicine.
Prostate cancer is the second most common malignancy among men worldwide and ranks second in cancer-related mortality (). Similar epidemiological trends have been observed in Türkiye. This highlights the critical public health importance of early detection and accurate identification of risk factors.
This study aims to comparatively evaluate the performance of binary LR and various ML algorithms, including SVM, K-nearest neighbors (KNN), chi-squared automatic interaction detection (CHAID), and C5.0, in identifying risk factors for prostate cancer and predicting disease status. By combining traditional statistical methods with modern ML approaches, this study reflects an integrated modeling strategy that can contribute to the development of effective clinical decision support systems.
This article is derived from the doctoral dissertation titled “a study on determining prostate cancer risk factors with LR analysis and ML algorithms”, completed at İstanbul University-Cerrahpaşa, Institute of Health Sciences.
Materials and Methods
This study utilized a cross-sectional design involving 501 male participants: 248 diagnosed with prostate cancer and 253 without prostate cancer. Participants were recruited from the Urology Outpatient Clinic of Göztepe Training and Research Hospital in İstanbul between April 2021 and September 2021. Data were collected face-to-face using a structured questionnaire, and informed consent was obtained from all participants through a signed consent form prior to participation.
The questionnaire was developed based on a review of current clinical guidelines and epidemiological literature on prostate cancer risk. It consisted of 20 items grouped into three domains: (i) sociodemographic characteristics (e.g., age, education level, marital status), (ii) clinical and urological symptoms (e.g., urinary frequency, hematuria, erectile dysfunction), and (iii) lifestyle-related and behavioral factors (e.g., smoking status, physical activity level, alcohol use, dietary fat intake). The questionnaire was reviewed by two urologists and a biostatistician for content relevance and clinical appropriateness before implementation.
Sample size determination was based on the rule of having at least ten cases per independent variable for LR analysis (, ). After excluding incomplete or inconsistent data, the final sample comprised 501 individuals. Ethics approval was obtained from the University of Health Sciences Türkiye, Hamidiye Scientific Research Ethics Committee (approval number: 21/125, dated: 19.03.2021).
Statistical Analysis
All analyses were conducted using IBM SPSS Statistics for Windows, Version 25.0 (IBM Corp., Armonk, NY, USA) and its Modeler module. Descriptive statistics were calculated for all variables. Categorical variables were summarized using frequencies and percentages, while continuous variables were presented as means and standard deviations.
Variables with a p-value less than 0.05 in univariate analysis were entered into the multivariate logistic regression model using the enter method. All statistical tests were two-sided, and p-values less than 0.05 were considered statistically significant.
Binary Logistic Regression: Binary logistic regression analysis was conducted to identify significant predictors of prostate cancer. Variables with a p-value less than 0.05 in univariate analysis were entered into the multivariate model using the enter method. Odds ratios (ORs), 95% confidence intervals (CIs), and p-values were reported.
SVM: The SVM model used a radial basis function kernel. Hyperparameters were optimized using a grid search approach combined with 10-fold cross-validation. Performance was assessed based on accuracy, sensitivity, specificity, and area under the curve (AUC) values.
KNN: The KNN model was implemented with k values ranging from 3 to 15. The optimal value of k was determined through cross-validation. The Euclidean distance metric was used for classification.
CHAID Decision Tree: The CHAID algorithm was used to construct a decision tree. Splits were based on chi-square tests with Bonferroni-adjusted significance levels. The model provided interpretable decision rules for classification.
C5.0 Decision Tree: The C5.0 model employed boosting and pruning to improve performance. This algorithm generated a set of classification rules and a decision tree to predict prostate cancer status. Model accuracy and AUC values were used for evaluation.
Model Evaluation: The dataset was randomly split into training (70%) and testing (30%) subsets. The performance of each model was evaluated on the test set using classification accuracy, sensitivity, specificity, and receiver operating characteristic (ROC) curves. AUC values were computed to assess discriminative power. Statistical significance was evaluated at a 95% confidence level.
Results
The demographic characteristics and clinical features of the participants are summarized in . Patients with prostate cancer had a significantly higher mean age (72±8.74 years) compared to healthy individuals (46±9.92 years). A significantly higher proportion of prostate cancer patients reported smoking, a family history of cancer, and urinary symptoms compared to the control group, as shown in .
Table 1. Demographic information of the participants
- | Group n (%) | ||
|---|---|---|---|
Patient | Healthy | ||
Marital status | Single | 50 (20%) | 148 (59%) |
Married | 176 (71%) | 79 (31%) | |
Other | 22 (9%) | 26 (10%) | |
Smoking | No | 32 (12.9%) | 189 (74.7%) |
Yes | 216 (87.1%) | 64 (25.3%) | |
Your level of education | Literate | 13 (5.24%) | 5 (1.97%) |
Primary school | 78 (31.4%) | 29 (11.4%) | |
Middle school | 51 (20.5%) | 47 (18.5%) | |
High school | 81 (32.6%) | 80 (31.6%) | |
University | 25 (10.0%) | 92 (36.3%) | |
Alcohol use | Yes | 86 (34.7%) | 67 (26.5%) |
No | 162 (65.3%) | 186 (73.5%) | |
Profession | Labourer | 23 (9.27%) | 16 (6.32%) |
Self-employment | 53 (21.3%) | 42 (16.6%) | |
Student | 0 (0%) | 37 (14.6%) | |
Academic staff | 14 (5.64%) | 6 (2.37%) | |
Civil servant | 37 (14.9%) | 45 (17.7%) | |
Not working | 18 (7.25%) | 7 (2.76%) | |
Pensioner | 50 (20.1%) | 36 (14.2%) | |
Health personnel | 30 (12.0%) | 28 (11.0%) | |
Teacher | 23 (9.27%) | 36 (14.2%) | |
Family history of cancer | No | 135 (54.4%) | 208 (82.2%) |
Yes | 113 (45.6%) | 45 (17.8%) | |
Patient: Individuals diagnosed with prostate cancer. Healthy: Individuals who have not been diagnosed with prostate cancer
Binary logistic regression identified several statistically significant risk factors: age (OR =1.103, p<0.001), smoking (OR =5.624, p<0.001), family history of cancer (OR =2.517, p=0.016), urinary frequency (OR =2.484 to 3.763, p<0.05), sedentary lifestyle (OR =2.672, p=0.004), and presence of blood in semen (OR =11.432, p<0.001). Binary logistic regression analysis revealed several statistically significant predictors of prostate cancer. Age was positively associated with cancer risk; each additional year of age increased the odds of prostate cancer by 10.3% (OR =1.103; 95% CI: 1.078-1.128; p=0.001). Smoking was one of the strongest predictors, increasing the risk more than fivefold (OR =5.624; 95% CI: 2.752-11.494; p=0.001). A positive family history of cancer doubled the likelihood of diagnosis (OR =2.517; 95% CI: 1.189-5.329; p=0.016).
Urinary frequency was another significant predictor. Compared to individuals who urinated five or fewer times per day, those who urinated 5-10 times had 2.48 times higher odds (OR =2.484; 95% CI: 1.095-5.637; p=0.029), and those who urinated more than 10 times had 3.76 times higher odds (OR =3.763; 95% CI: 1.491-9.496; p=0.005).
Sedentary behavior significantly increased the risk; individuals with sedentary behavior had 2.67 times higher odds compared to those who regularly exercised (OR =2.672; 95% CI: 1.638-14.487; p=0.004).
Notably, the presence of blood in semen was associated with an elevenfold increase in prostate cancer risk (OR =11.432; 95% CI: 2.763-47.289; p=0.001). The regression coefficients and full model statistics are presented in . Model fit was acceptable according to the Hosmer-Lemeshow test (c² =12.112; p=0.146), and model performance metrics are shown in and .
Table 2. Binary logistic regression analysis results
- | β | S.E. | Wald | p-value | OR (95% CI) |
|---|---|---|---|---|---|
Your age | 0.098 | 0.012 | 70.142 | 0.001 | 1.103 (1.078-1.128) |
Cigarette (yes) | 1.727 | 0.365 | 22.425 | 0.001 | 5.624 (2.752-11.494) |
Presence of cancer in the family (yes) | - | - | 5.824 | 0.016 | 2.517 (1.189-5.329) |
How often do you urinate | 0.923 | 0.383 | 8.898 | 0.012 | - |
How often do you urinate (1) | - | - | 4.741 | 0.029 | 2.484 (1.095-5.637) |
How often do you urinate (2) | 0.91 | 0.418 | 7.876 | 0.005 | 3.763 (1.491-9.496) |
Lifestyle during the day | 1.325 | 0.472 | 12.841 | 0.002 | - |
Lifestyle during the day (1) | - | - | 8.111 | 0.004 | 2.672 (1.638-14.487) |
Lifestyle during the day (2) | 0.983 | 0.556 | 0.973 | 0.324 | 0.683 (0.320-1.457) |
Blood in semen | -0.381 | 0.387 | 11.31 | 0.001 | 11.432 (2.763-47.289) |
Constant | 2.436 | 0.724 | 29.771 | 0.001 | - |
Hosmer-Lemeshow test (x2=12,112; df=8; p=0.146); Omnibus test (x2 =35,62; df=8; p=<0.001); -2log likehoold= 228,115; Cox-Snell R2= 0.706; Nagelkerke R2= 0.808; How often do you urinate= 5 and below How often do you urinate (1)= 5-10; How often do you urinate (2)= 10 or more; Lifestyle during the day= I do sports; Lifestyle during the day (1)= I am sedentary; Lifestyle during the day (2)= I do not do sports but I am active during the day. β: Beta, S.E.: Standard error, OR: Odds ratio, CI: Confidence interval
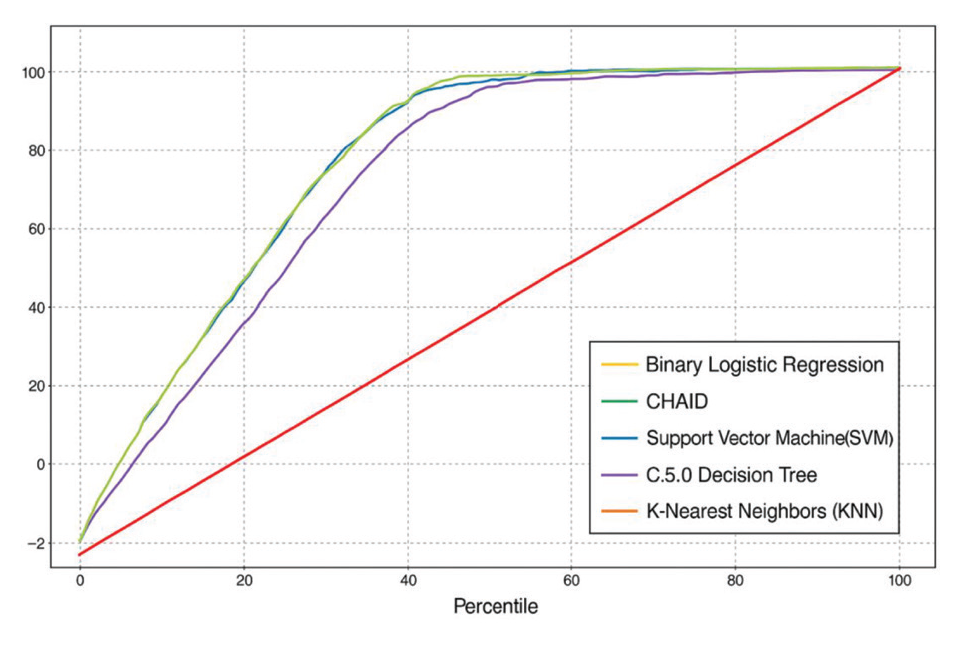
ROC: Receiver operating characteristic, CHAID: Chi-squared automatic interaction detector
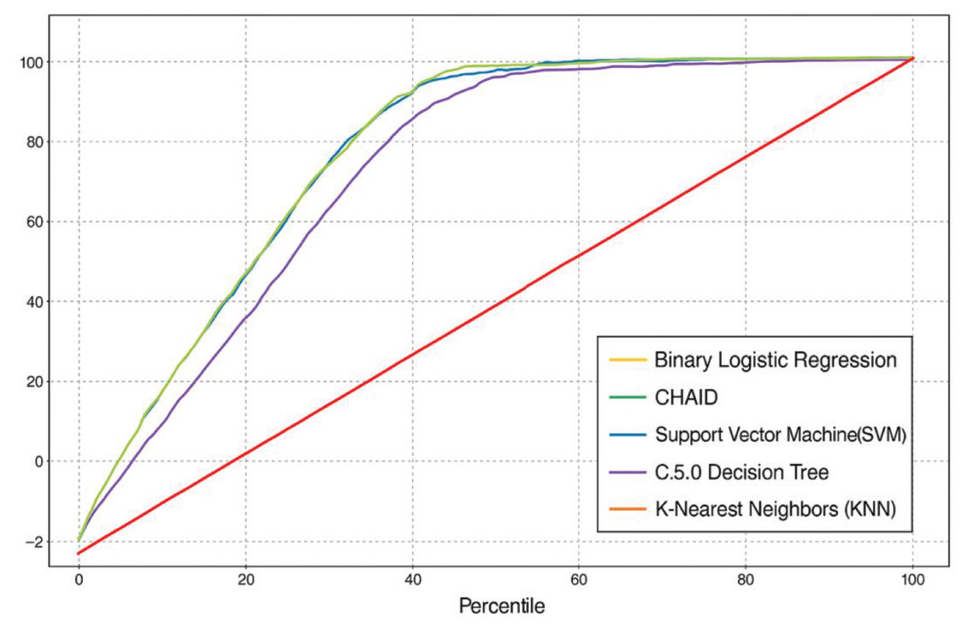
CHAID: Chi-squared automatic interaction detector
The detailed regression coefficients and ORs are provided in . Each model identified overlapping but distinct sets of predictive variables. While age, smoking, and family history of cancer were common variables across models, SVM also included variables like fat consumption and chronic disease status, CHAID considered erectile dysfunction, and C5.0 emphasized urinary frequency and daily lifestyle. The variables identified by each model are summarized in .
Table 3. Risk factors of the models obtained from the analyses
Models | Risk factors |
|---|---|
LR | Age, smoking, presence of cancer in the family, frequency of urination, lifestyle during the day and blood in semen and urine |
SVM | Age, frequency of urination, smoking, family history of cancer, lifestyle during the day, fat used in food, presence of chronic diseases, blood in semen or urine, daily water consumption and discomfort in the groin area |
KNN | Age, smoking, presence of cancer in the family |
CHAID | Age, smoking, frequency of urination, erectile dysfunction and presence of cancer in the family |
C5.0 | Age, smoking, urinary frequency, daily lifestyle and family history of cancer |
CHAID: Chi-squared automatic interaction detection, KNN: K-nearest neighbors, LR: Logistic regression, SVM: Support vector machine
The classification results for each algorithm are presented in . Additionally, confusion matrix-based classification metrics, such as sensitivity, specificity, accuracy, and approximate AUC values, are shown in .
Table 4. Classification rates of the analyses
Model | Classification | Education data | Trial data |
|---|---|---|---|
- | Number of independent variables | 10 | 10 |
- | Those with prostate cancer | 97.1 | 94.4 |
SVM | Those without prostate cancer | 98.92 | 85 |
- | Percentage classification of correct | 98 | 89.92 |
- | Number of independent variables | 3 | 3 |
- | Those with prostate cancer | 90.9 | 88.8 |
KNN | Those without prostate cancer | 97.84 | 88 |
- | Percentage classification of correct | 94.47 | 88.48 |
- | Number of independent variables | 5 | 5 |
- | Those with prostate cancer | 93.18 | 90.54 |
CHAID | Those without prostate cancer | 91.93 | 92.3 |
- | Percentage classification of correct | 92.54 | 91.36 |
- | Number of independent variables | 5 | 5 |
- | Those with prostate cancer | 90.34 | 87.5 |
C5.0 | Those without prostate cancer | 96.77 | 89.5 |
- | Percentage classification of correct | 93.64 | 88.48 |
- | Number of independent variables | 6 | 6 |
Binary logistic regression | Those with prostate cancer | 94.2 | 92.1 |
Those without prostate cancer | 95.1 | 92.3 | |
Percentage classification of correct | 94.6 | 92.2 |
CHAID: Chi-squared automatic interaction detection, KNN: K-nearest neighbors, SVM: Support vector machine
Table 5. Classification performance of models based on test data
Model | TP | FN | TN | FP | Sensitivity (%) | Specificity (%) | Accuracy (%) | AUC |
|---|---|---|---|---|---|---|---|---|
SVM | 68 | 4 | 57 | 10 | 94.4 | 85.0 | 89.92 | 89.76 |
KNN | 64 | 8 | 59 | 8 | 88.8 | 88.0 | 88.48 | 88.47 |
CHAID | 67 | 7 | 60 | 5 | 90.54 | 92.3 | 91.36 | 91.42 |
C5.0 | 63 | 9 | 60 | 7 | 87.5 | 89.5 | 88.48 | 88.53 |
Logistic reg. | 70 | 6 | 60 | 5 | 92.1 | 92.3 | 92.2 | 92.21 |
AUC: Area under the curve, CHAID: Chi-squared automatic interaction detection, FN: False negative, FP: False positive, KNN: K-nearest neighbors, reg.: Regression, SVM: Support vector machine, TN: True negative, TP: True positive
shows the ROC curves for each classification model. logistic regression achieved the highest AUC value (0.922), indicating superior discriminative performance in distinguishing patients with and without prostate cancer. The CHAID model followed with an AUC of 0.914, while SVM and KNN showed comparable performance with AUCs of 0.897 and 0.884, respectively. The C5.0 model yielded the lowest AUC (0.885), which is still considered to have acceptable predictive power.
presents the cumulative gain chart for the classification models. Logistic regression demonstrated the steepest cumulative gain curve, indicating the most effective identification of true positive cases within a smaller portion of the population. This further supports the model’s robustness in clinical screening contexts. SVM and CHAID also showed strong performance, while C5.0 and KNN were relatively less efficient in early-stage detection based on gain curve profiles.
Discussion
This study compared the predictive capabilities and risk factor identification accuracy of logistic regression analysis and several ML algorithms in the context of prostate cancer. Logistic regression emerged as the most effective method based on classification accuracy, which can be attributed to the linear nature of relationships in the dataset. These findings align with existing literature emphasizing the strength of logistic regression in clinical applications where model interpretability and probabilistic outcomes are essential (). This is in line with findings from Morote et al. (), who highlighted logistic regression’s interpretability and robustness when applied to structured clinical datasets.
Nevertheless, ML methods provided additional insights by capturing non-linear interactions and incorporating a broader range of features. For instance, the SVM model identified variables such as dietary fat consumption and chronic illnesses, which were not prominent in the logistic regression model. This suggests that ML models may offer advantages in uncovering hidden patterns that are not easily detected by traditional statistical approaches (). Similar results were reported by Chen et al. (), who found that SVM and other ML models could identify non-linear relationships and less obvious predictors in prostate cancer datasets.
The CHAID and C5.0 decision tree algorithms also performed well, with CHAID achieving over 91% accuracy. These algorithms provide intuitive, rule-based outputs that can be useful in clinical settings, especially for decision support tools. KNN, while simpler, still demonstrated solid performance, though it may be less scalable with larger datasets or higher dimensionality ().
Our findings are consistent with previous studies that support the integration of ML in medical diagnostics. Our identification of age, smoking, and family history as significant predictors aligns with well-established risk factors reported in epidemiological studies (). However, one must consider the complexity and interpretability of ML models when applying them in clinical practice. Logistic regression retains value due to its transparency and ease of implementation, particularly when working with structured and relatively low-dimensional datasets ().
A limitation of this study includes the sample size, which may affect the generalizability of the results. Additionally, imbalanced age distributions between patient and control groups may have influenced model performance. It is acknowledged that the observed age disparity between groups is inherent to the epidemiology of prostate cancer, as the disease predominantly affects older males (). However, the strong predictive power of age might have overshadowed other relevant variables in both logistic regression and ML models. Future studies might benefit from age-stratified analyses to assess the isolated contribution of additional predictors.
Conclusion
This study demonstrated that both logistic regression and ML algorithms are effective in identifying significant risk factors and predicting prostate cancer. Logistic regression showed the highest overall classification accuracy and remains a robust choice for structured clinical data.
Key risk factors identified across models included age, smoking, family history of cancer, urinary frequency, and blood in semen. These findings highlight the importance of early detection and suggest that integrating both statistical and ML methods could enhance decision-making in prostate cancer screening and diagnosis.
Future studies should focus on expanding data diversity, improving model interpretability, and integrating additional clinical and genetic variables to support more personalized healthcare strategies. In light of these findings, the integration of hybrid analytical frameworks that combine traditional statistical models with ML algorithms should be encouraged in clinical settings. Such a blended approach can facilitate earlier risk stratification, support personalized decision-making, and contribute to the development of more effective prostate cancer screening protocols. Future research may also explore the implementation of these models into real-world clinical decision support systems to assess their practical utility and scalability.
Ultimately, blending statistical rigor with the predictive depth of ML may help transform prostate cancer screening from a reactive to a more proactive approach.
Footnotes
Ethics
Ethics Committee Approval: Ethics approval was obtained from the University of Health Sciences Türkiye, Hamidiye Scientific Research Ethics Committee (approval number: 21/125, dated: 19.03.2021).
Informed Consent: Data were collected face-to-face using a structured questionnaire, and informed consent was obtained from all participants through a signed consent form prior to participation.
Authorship Contributions
Concept: S.A., M.K., Design: S.A., M.K., Data Collection or Processing: S.A., M.A., M.Ç., Analysis or Interpretation: S.A., Literature Search: S.A., Writing: S.A.
Conflict of Interest: No conflict of interest was declared by the authors.
Financial Disclosure: The authors declared that this study received no financial support.
References
Alpar R. Applied multivariate statistical methods. 3 rd ed. Ankara: Detay Publications; 2011.
Bewick V, Cheek L, Ball J. Statistics review 14: logistic regression. Crit Care. 2005;9:112-118.
Tabachnick BG, Fidell LS. Using multivariate statistics. 6 th ed. Boston: Pearson; 2015.
Concato J, Feinstein AR, Holford TR. The risk of determining risk with multivariable models. Ann Intern Med. 1993;118:201-210.
Atakurt Y. Lojistik regresyon analizi ve tıp alanında kullanımına ilişkin bir uygulama. Ankara Üniversitesi Tıp Fakültesi Mecmuası. 1999;52.
Saravanan R, Sujatha P. State-of-the-art techniques in machine learning algorithms: a perspective on supervised learning approaches for data classification. IEEE. 2018.
Rubinstein I. Big Data: The end of privacy or a new beginning? International Data Privacy Law. 2013;3:74-87.
Özlüer Başer B, Yangın M, Sarıdaş ES. Makine öğrenmesi teknikleriyle diyabet hastalığının sınıflandırılması. Süleyman Demirel Üniv Fen Bilim Enst Derg. 2021;25:112-120.
Ayodele TO. Types of machine learning algorithms. In book: New Advances in Machine Learning. 2010.
Mahesh B. Machine learning algorithms – a review. Int J Sci Res. 2019;9:ART20203995.
Greenlee RT, Murray T, Bolden S, Wingo PA. Cancer statistics, 2000. CA Cancer J Clin. 2000;50:7-33.
Akgül A, Çevik O. Statistical analysis techniques: business management applications in SPSS. Ankara: Emek Ofset Ltd.; 2003.
Kılıçarslan MS, Şahin K, Aktaş S. Prostate cancer diagnosis with data mining techniques: logistic regression analysis and decision tree application. Turkish Journal of Urology. 2019;45:456-462.
Morote J, Lorente JA, Raventós CX, Planas J. Comparison of logistic regression and artificial neural networks for prostate cancer prediction in a population-based screening cohort. Cancers. 2025;17:1101.
Aydın Atasoy N, Demiröz A. Makine öğrenmesi algoritmaları kullanılarak prostat kanseri tümör oluşumunun incelenmesi. Avrupa Bilim ve Teknoloji Dergisi. 2021:87-92.
Chen R, Zhang C, Li M, Sun F, Wang H, Zhao Z. Development and validation of machine learning models for the prediction of prostate cancer risk. Front Oncol. 2022;12:910278.
American Cancer Society. Prostate cancer: risk factors [Internet]. Atlanta (GA): American Cancer Society; 2024 [cited 2025 Aug 28].