Introduction
Nowadays, more accurate, reliable and reproducible results can be achieved with quality improvement programs and improvements in clinical laboratories in order to be sufficiently beneficial to patients. However, despite all these improvements, results are not completely accurate or reliable. Medical decisions contain some margin of error since they are affected by laboratory results. Therefore, when reporting the result of a measurement, a numerical indicator (expressing the quality of the result) containing this doubt should be added. Without such an indication, the results could not be compared with each other or with the values given in the standards (1,2). This can only be achieved by calculating the uncertainty of values obtained from the measurement and by reporting it with results.
The Guide to the expression of uncertainty in measurement (GUM) defines measurement uncertainty as “a parameter indicating the distribution of probabilities reported along with the measurement result and attributable to the measurement result”. The International Vocabulary of Metrology - Basic and General Concepts and Associated Terms (VIM, item 2.26), on the other hand, defines it as a non-negative parameter that characterizes the distribution of values attributed to the measured (2). GUM and the Eurachem guideline adapted to the GUM in chemical measurements calculate uncertainty according to the bottom-up approach. This approach is based on identifying each potential source of uncertainty and calculating the individual uncertainty values for each component. The top-down approach is a method that uses existing laboratory test performance information (method validation, intra- and inter-laboratory CV data) (3).
The purpose of the measurement uncertainty is to help evaluating whether the result of one sample is significantly different from the other results. However, the uncertainty of measurement is not sufficient by oneself for the significance of the difference between the results obtained in successive measurements. To solve this issue, different parameters or concepts should be implemented (4,5). One of the most applicable parameters is the reference exchange value (RCV), which tests the significance between two measurements by taking analytical and biological variations into account.
There are two components of biological variation, intra-individual and inter-individual. Intra-individual biological variation (CVI) is expressed as random fluctuations of components in the human body at the homeostatic set points. Random fluctuations, caused from individual changes, develop depending on the aging process, sex, weight, diet, exercise, hemostasis, daily or seasonal rhythms and, of course, pathological status and treatment. The variation in these differences is known as between-subject or inter-individual biological variation (CVG) (4,6).
Medical laboratory results are compared with reference intervals for healthy individuals. However, a result within the reference interval does not guarantee that the result is normal for a specific patient. At this point, RCV, which includes biological variation and analytical variation, is used, which is a significant indicator of the change between the successive test results of the individual (5).
In this study, measurement uncertainty and RCVs of two different autoanalysers (Abbott Architect ci4100 and ci8200) were calculated in Medical Biochemistry Laboratory at University of Health Sciences Turkey, Haydarpaşa Numune Training and Research Hospital. Measurement uncertainty values were compared with the internationally accepted total allowable error limits to evaluate the quality of the results. Measurement uncertainty and the use of RCV together were also evaluated in the assessment of patient results.
Material and Methods
Ethical approval for this retrospective study was obtained from the Ethics Committee of University of Health Sciences, Haydarpaşa Numune Training and Research Hospital (HNEAH-KAEK 2017/KK/94). Informed consent from patients was not required. The Nordtest guide, “top-down” approach, was used to estimate measurement uncertainty. The calculations were performed using internal quality control (IQC) and external quality control (EQC) data.
Statistical Analyses
IQC Data
The original control sera supplied by Architect were studied 2 times a day (08 am and 06 pm) for all parameters to obtain IQC data (uncertainty-analytical process from reproducibility). Each lot has been evaluated and mean values, standard deviation (SD) and coefficient of variation (CV) values for each level were obtained.
EQC Data
EQC data of KBUDEK program were used for the bias calculation.
Calculation of Measurement Uncertainty
Measurement uncertainty calculation was completed in six stages as follows:
1. Definition of measurement
Measured parameter are; albumin, amylase, alanine transaminase (ALT), total bilirubin, direct bilirubin, blood urea nitrogen (BUN), Ca, Cl, creatinine, glucose, K, LDH, CK, lipase, Mg, Na, total protein, P, C-reactive protein (CRP), aspartate transaminase (AST), β-human chorionic gonadotropin (HCG), creatine kinase (CK) -MB (mass) and troponin-I. Serum sample was used for all tests.
2. Calculation of within-laboratory reproducibility (Rw) component of uncertainty
Using the daily IQC data of each test, the mean, SD and CV values, respectively, were calculated as follows:
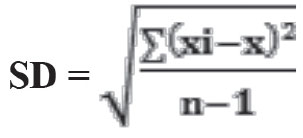
xi: measurement result, x: mean value, n: number of measurements
CV% = 100*SD/ x
Rw= √[(CV1)2+(CV2)2+ ....)LI+(CV1)2+(CV2)2+ ....)L2+(CV2)2+ ...)L3]/n
CV1: CV% during the period (n times) used for lot 1, CV2: CV% for lot 2
L1: Low, L2: Normal and L3: High level, n: Total number of CV%
3. Calculation of bias component of uncertainty:
The bias can be obtained from certified reference material or EQC data. EQC data were used in this study.
Since it is recommended to use at least 6 attendance data over a given period of time (at least one year) to obtain reliable bias results from EQC data (7), 6 data were used (every 2 months) for CRP and 12 data for all other parameters (once a month).
u(bias) is divided into two as laboratory bias (RMSbias) and uncertainty component for the certified material [u(Cref)].
The calculations were performed accordingly using the following formulas:
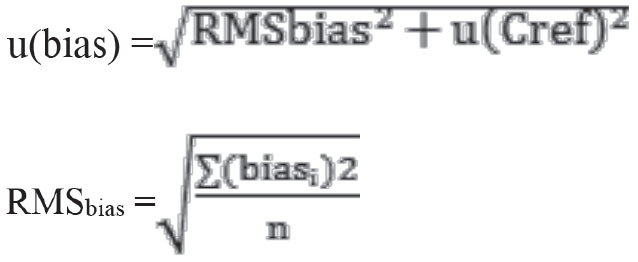
biasi: bias % value of the test at that period, n: the number of periods of participation in EQC
Calculation of the bias value of the laboratory from the EQC program;
biasi= 100 x |Clabi - Clabref| / Clabref
Clabi: Laboratory measurement result, Clabref: Average measurement results of laboratories using the same method and device.
u(Cref) = CVR / √nLab
To calculate the CVR, CV% values for all periods given in the EQC reports for the relevant test are summed and divided by the number of periods.
nLab: For each period of participation, the number of laboratories was summed, and the total number was divided by the number of periods.
4. Conversion of components to standard uncertainty u(Rw)
The Rw values obtained in the second step were divided by 2 within the 95% confidence interval (CI) and the standard uncertainty value u(Rw) was obtained (8).
u(Rw) = Rw/2
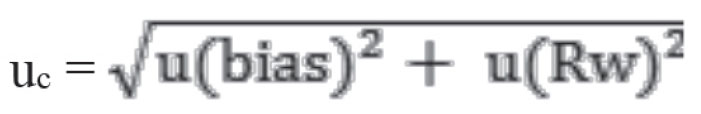
5. Calculation of combined standard uncertainty, (uc)
6. Calculation of expanded uncertainty (U)
U= k x uc k=2
The k-value was taken as approximately 2, representing 95% CI (9).
Rilibak limits were taken as the target value, since no limit value was specified for β-hCG in both guidelines. For β-HCG, Rilibak (Germany) has determined acceptable RMSD (% root mean SD) as 14 % (10).
An algorithm including all the above steps in the calculation of measurement uncertainty is presented in Figure 1.
Calculations of Reference Change Value
Tests for which RCV was determined; albumin, amylase, ALT, total bilirubin, direct bilirubin, BUN, Ca, Cl, creatinine, glucose, K, LDH, CK, lipase, Mg, Na total protein, P, CRP, AST, β-HCG, CK -MB (mass) and troponin-I.
In the calculation of RCV, analytical CV (CVA) values obtained using one-year IQC and intra-individual biological variation coefficient (CVI) were used. CVI values of serum samples for all tests were obtained from the Westgard website. RCV for β-HCG was not calculated because the CVI value was not available on the Westgard website. RCV calculation was performed using classical Fraser formula and logarithmic transformation formula.
RCV (Fraser formula) = Z x 21/2 x CVT
“Z”-value is 1.65 for one-way change in 95% CI while 1.96 for bidirectional change (11). In this study, the Z-value was assumed to be 1.65, since the percentages of change in one direction were calculated.
The steps in the study of Lund et al. (12) were followed in the application of the logarithmic transformation formula to identify significant change in bidirectional.

Reference change factor up (RCFup) and reference change factor down (RCFdown) were obtained by using CVT and Z-values.
RCFup= exp (Z x √2 x CVT/100)
RCFdown= 1/RCFup
The patient’s first test result was multiplied by the RCFup value to determine the significant increase in consecutive test results of the patient. If the second test result was higher than this product result, this increase was considered significant. Likewise, the patient’s first test result was multiplied by the RCFdown value. If the second test result was lower than the value obtained by this product result, this decrease was considered significant.
The individuality index (II) was used to determine the RCV value to be used to evaluate the significance of the change in successive test results as follows (13). CVI and CVG values were obtained from Westgard’s website.
II= CVI/CVG
Microsoft office 2010 was used for statistical analysis and graphics design.
Results
• Results of Measurement Uncertainty
When U-values were examined, the results of the uncertainty obtained from all tests analyzed on our Architect ci4100 and ci8200 devices were within the CLIA’88 total error limits (Table 1, 2). However, it was observed that the uncertainty values determined for albumin, Ca, Cl, Mg, Na and total protein analyzed on both devices did not reach the Westgard total error limits. The uncertainty value for β-HCG analyzed in the Ci8200 autoanalyser was 11.7%. While this value was within the limits, the uncertainty value estimated in the ci4100 instrument was out of the limit (18.78%).
Results of RCV
In the analysis based on the II of amylase, ALT, CK, creatinine, LDH, Mg, total protein, CRP, AST, CK-MB (mass), and troponin-I were <0.6 (Table 3). Accordingly, it was considered that the use of RCV in these tests was more appropriate. On the other hand, it was found that RCV could be used in addition to community-based reference intervals for albumin, total bilirubin, direct bilirubin, urea, calcium, chlorine, glucose, potassium, lipase, sodium and phosphorus with a high II (≥0.6).
The RCV values obtained using both the Fraser method and the logarithmic transformation formula are as shown in Table 4 for all these tests. After applying the logarithmic transformation formula, one-way change values at 95% CI for each test were calculated separately as positive increase and negative decrease.
RCVs of total bilirubin, direct bilirubin, creatinine kinase, lipase and troponin-I tests calculated by logarithmic transformation were higher in increasing direction and lower in decreasing direction than the Fraser method. The RCV calculated according to the Fraser method exceeded 100% in decreasing direction, whereas the RCV calculated using logarithmic transformation was below 100% for CRP parameter (Figure 2).
Discussion
The appropriate application of modern medicine is unlikely without test results which are performed in clinical laboratories. In laboratory, the measurement of these tests is carried out by a series of complex precision instruments and various automated electronic equipment using test procedures. However, no test result is completely certain. These errors and uncertainties in test results may also vary depending on the measurement system, measurement procedure, operator skill, environmental situations and other influencers. Due to this distribution, the concept of uncertainty of measurements was needed to express the uncertainty in numbers (1,14,15). In brief, the measurement uncertainty is the doubt that exists about any measurement results.
The basic assumption in calculating measurement uncertainty is based on providing information for the identification and correction of all systematic errors at early stage of the assessment process. The quality of a measurement is linked to the fact that uncertainty about random and systematic error (bias) is taken into account on the correct basis (16). It therefore includes all factors that affect the interpretation of the value used for diagnosis, treatment, and monitoring of patients. Furthermore, understanding the analytical aspects of the test for each laboratory is possible by defining the measurement uncertainty, which helps in the implementation of good clinical practice and reduces errors (17). Otherwise, these errors may increase medical costs and cause patients to be misdiagnosed, and even put patients in dangerous situations. Therefore, although measurement uncertainty is relatively new for clinical laboratories, it is an important issue (18). The measurement uncertainty is the datum that ensures the reliability of the result.
Two main approaches are recommended by international guidelines for calculating uncertainty. The bottom-up approach involves a comprehensive examination of measurements. In this approach, each source of uncertainty is determined one by one and the combined uncertainty value is obtained (3). The top-down approach is generally based on the evaluation of EQC data with IQC data. In studies conducted on the calculation of measurement uncertainty of some tests, it has been concluded that the results of measurement uncertainty obtained using both approaches are equivalent and can be used interchangeably (19).
The measurement uncertainty in clinical laboratories according to the down-to-up approach is difficult and time consuming. However, the up to down approach is based on bias and intra-laboratory reproducibility values. For this reason, clinical laboratories prefer this method, which is more simple in applicability, to calculate measurement uncertainty. Moreover, if the analytical conditions for total imprecision are met, the uncertainty components do not need to be identified and estimated separately unless there is a specific clinical objective. In addition, since the effects of uncertainty sources such as calibrator and reagent changes, technician change, humidity and temperature fluctuations are reflected to the IQC data in the long term, the top-down approach for determining the measurement uncertainty seems more useful for the laboratory (20,21). For these reasons, we used the 6-step Nordtest guide with top-down approach to calculate measurement uncertainty in this study. Adhering to these principles, the U values calculated from all the tests analyzed on our Architect ci4100 and ci8200 devices were within CLIA’88 total error limits, indicating that these values could be used for our laboratory. However, the U values calculated for albumin, Ca, Cl, Mg, Na and total protein were outside the Westgard limits. This finding suggested that improvements should be made to reduce the sources of error for these tests.
For albumin test, U values in Architect ci8200 instruments were found as 5.98%. This value was consistent with the study performed by Bal et al. (18) on three different devices for albumin (U= 7.35%, 6.49% and 6.47%, respectively). However, this value was higher than the U value (3.4%) determined by Iqbal et al. (22) for albumin. The U values (9.46%) determined for the albumin test in Architect ci4100 device were well above these data of two researches.
When some of the results obtained in our study were compared with previous studies, it was observed that U values (4.73% and 5.25%) found in Architect ci4100 and ci8200 devices for Ca test were much higher than those found for plasma samples (0.12%) by Padoan et al. (23) However, it was found that U values (2.57% and 2.86%) found in Architect ci4100 and ci8200 devices for Cl test were lower than those determined by Padoan et al. (23) (3.76%). For the Mg test, U values (6.82% and 11.36%) found in Architect ci4100 and ci8200 devices were higher than those determined by Iqbal et al. (22) (4%) for their devices. The U values for the Na test in Architect ci4100 and ci8200 devices were 2.18% and 2.66% respectively, while Bal et al. (18) found that U values for the same analyte were close to our values as 2.32%, 2.21% and 2.07%, respectively. Padoan et al. (23) found that U value for Na was 1.81%. For the total protein test, the U values of Architect ci4100 and ci8200 devices were 6.17% and 5.39%, respectively, whereas Bal et al. (18) obtained U values for their 3 different devices as 8.40, 8.51% and 8.39% respectively. Iqbal et al. (22) found the uncertainty value of 4.7% for total protein. According to all the above data, we had better performance compared to Bal et al. (18), worse than Iqbal et al. (22) and different analyte-based performances with Padoan et al. (23).
When we examine our uncertainty results in detail, a bias error usually has a greater share. As a laboratory, we make our accuracy according to our results in the EQC program. However, the concentration of the analyte in the EQC sample is not given. Instead, the average of the measurement results of all laboratories participating in the EQC program is considered the real value. Therefore, this value also includes the errors of each laboratory from the analytical process during the measurement. As the number of laboratories participating in the EQC program increase, the errors of the laboratories from this analytical process decrease to insignificant levels. Thus, it is accepted that the measurement results of the laboratories participating in the EQC program are remarkably close to the actual value. It is not recommended to use imprecision to estimate the measurement uncertainty resulting from the performance of laboratories in the EQC program when participation in the EQC program is low because there is generally less data for estimating uncertainty (20).
Another important factor affecting the EQC results and therefore the size of the bias result is that the samples are in lyophilized state (24). Therefore, the bias values of all tests belonging to the period in which the pipetting error during the reconstitution phase has been made will tend to come up high. The suggestion of glass pipettes in the reconstitution of such samples reduces the pipetting error but does not completely eliminate it. The best way to minimize bias resulting from the reconstitution of lyophilized samples is to use liquid samples instead of lyophilized samples for EQC, or to use standard dilution samples with lyophilized samples. In the light of this information, we think that our U values may be higher depending on the lyophilized EQC samples.
In the evaluation of the test results of individuals, reference intervals which are determined by age, gender and other variables that are not very compatible for themselves are used. This allows data to be used only in a superficial manner. However, it does not consider the basic information about reference intervals and the individual and inter-individual factors of the analytes. Therefore, it is controversial to evaluate the individual successive test results according to population-based reference intervals (25,26). Because, although there is no change (improvement or deterioration) in patients’ current health status, one of the patients’ consecutive results may be within the reference interval and the other may be out of the reference interval.
The reason for the changes observed in a person’s successive test results may be due to the improvement of his clinical condition or vice versa, and was mostly attributed to CVI and CVA variables (27). RCV can be detected using these variables. Although two-way change is generally used in RCV calculations, according to Cooper et al. (28), one-way change is more appropriate. Fraser also made similar recommendations when evaluating sequential troponin measurements in the assessment of acute cardiac cases (28). Therefore, we made our calculation based on one-way change. Since the analytical CV values of almost all tests on the Architect ci8200 device are higher than on the Architect ci4100, the CVA values of our Architect ci8200 device, which represent a wider range in RCV calculations, were based on.
The II determines whether the reference interval or RCV is preferred for the evaluation of individual test results. The use of population-based reference interval is not considered appropriate when the II is less than 0.6 because this reference interval will cover a very few individuals and will provide very limited benefit in assessing whether there is a significant change in results (29). Therefore, it would be more appropriate to compare the results with the previous basal results. For tests with an II greater than 1.4, reference interval should be preferred. It is reported that RCVs as well as reference intervals are more suitable for the evaluation of tests with an II less than 1.4 (4).
In a study conducted by Ko et al. (30), they calculated the RCV values as bidirectional at 95% CI according to the classical Fraser method. RCV values were found to be 9.47% for albumin, 5% for ALT, 24.2% for amylase, 34.4% for AST, 33.7% for BUN, 6.7% for calcium, 4.3% for Cl, 18% for creatinine, 102.1% for direct bilirubin, 15.8% for glucose, 12.9% for K, 24% for LDH, 3.2% for Na, 7.9% for total protein, 22.7% for P, and 60.5% for total bilirubin; respectively (30). These values were close to almost all our values except direct bilirubin. The decreasing RCV value determined by Ko et al. (30) for bilirubin was unusable because it exceeded 100%. However, in our study, we found that the RCV value for the direct bilirubin in the decreasing direction with the classical Fraser approach was less than 100% and the RCV value calculated with the logarithmic transformation approach was -58.05%. As can be seen from this, it is not possible to use the Fraser approach in the decreasing direction, while the clinical use of the value determined by the logarithmic transformation approach is possible.
The RCV values obtained by Walz and Fierz by applying logarithmic transformation were close to the RCV values calculated in our study. There is a significant difference between only the RCV results of troponin-I test (140% and - 58%) (31). In our study, a narrower range was found for troponin-I test. This difference was probably attributable to the difference in analytical performance between laboratories and the type of sample used for troponin-I measurement. These researchers used plasma CVI values for troponin-I. Since the sample matrix, which is most suitable for analyzing, can be evaluated by the smallness of the CVI value, these researchers have obtained a larger RCV value, probably due to plasma use. However, we used serum samples in our study. In both studies, the reason for reaching similar results for many tests was attributed to the similar biological variation values as well as the close analytical performance of the instruments and kits.
Normally, the intra-individual biological variation shows a random fluctuation due to the homeostatic fluctuations of the individual (homeostatic set points). In addition, wider biological fluctuations will be observed in abnormal metabolic conditions such as disease, drug use, pregnancy and menopause. Therefore, in determining RCV values, it is considered that it is more appropriate to use the classical Fraser method for normal distribution tests and logarithmic transformation method for non-normal distribution tests. Furthermore, it is not possible to use RCV values calculated by the Fraser method above 100% in the direction of decrease, because such a reduction is not possible for repeated tests. In particular, it is considered that the logarithmic conversion formula should be preferred for tests that do not show normal distribution and have a wide biological variation (CRP, direct bilirubin, total bilirubin, troponin, creatinine kinase) (4,6). In summary, since a significant proportion of individuals applying to hospitals consist of individuals with disease, drug use or abnormal metabolic conditions, laboratories should be able to calculate RCV values using both classical Fraser and logarithmic transformation and keep this information available.
Conclusion
Each laboratory should calculate MU values to bring the reliability of test results close to international limits. Logarithmic transformation formulas should be used in the RCVs calculation of tests with high biological variation, such as CRP. In addition, MU and RCV should be given with the test results to improve diagnostic accuracy.
Ethics
Ethics Committee Approval: Ethical approval for this retrospective study was obtained from the ethics committee of University of Health Sciences, Haydarpaşa Numune Training and Research Hospital (HNEAH-KAEK 2017/KK/94).
Informed Consent: Informed consent from patients was not required.
Peer-review: Externally and internally peer-reviewed.
Authorship Contributions
Project Development: F.Ö., A.K., M.M.Y., Data Collection or Processing: H.H.P., E.S., Ş.K., M.Z.Ç., A.K., M.M.Y., Analysis or Interpretation: F.Ö., Manuscript Editing: A.K., M.M.Y., H.H.P., E.S., Ş.K., M.Z.Ç., Writing: F.Ö.
Conflict of Interest: No conflict of interest was declared by the authors.
Financial Disclosure: The authors declared that this study received no financial support.